


Confluence Areas in Forex Trading
Confluence Areas in Forex Trading
Confluence areas in Forex trading are defined as places where more than one pattern shows the same direction.Technical analysis is one of the reasons why retail traders come to the currency market.
The ability of patterns to help predict future prices has always fascinated traders and people alike.
Since the early days of stock market in the United States, traders noted that the price forms similar patterns before significant advances or declines. In today’s language, it is said that the market “builds energy” before continuing or reversing a trend.
Simply put, it consolidates due to a lack of direction.
Confluence areas in Forex trading aren’t only technical in nature. Traders find it more comfortable to trade technical patterns in the same direction as fundamental analysis points to.
That’s a confluence area that supports a trade, as it blends both technical and fundamental aspects.
Bonus Material: CLICK HERE TO DOWNLOAD FREE CANDLESTICKS E-BOOK
Confluence Areas in Forex Trading and What to Expect
In this article we’ll cover everything about confluence areas in Forex trading, using concepts like:
- classic technical analysis patterns
- Japanese technical analysis reversal and continuation patterns
- classic and dynamic support and resistance
- where does fundamental analysis fit in
- how to combine different technical analysis concepts to find confluence areas in Forex trading
More importantly, we’ll focus on showing how to find the path of least resistance for future trades. As always, discipline is critical, second to nothing in Forex trading.
Support and resistance areas are key when looking for confluence. When traders use too many technical indicators or oscillators, it is said that the chart becomes crowded.
Remember: Too many technical tools won’t help the analysis.
However, this is not the case when looking for confluence areas in Forex trading. In doing that, the more elements pointing to the same direction, the better.
Support and Resistance – Key to Find Confluence Areas in Forex Trading
The price of a currency pair meets two types of support and resistance: classic and dynamic.
Classic means support or resistance forms on the horizontal. Think of double or triple tops and bottoms, for instance, as the most representative forms of classic support and resistance.
Dynamic, on the other hand, is more powerful. Because it’s ability to follow the price action, dynamic support and resistance levels weigh more in the eyes of the technical traders.
However, the balance of power changes when support and resistance combine with other patterns to form confluence areas in Forex trading.
For instance, classic patterns forming at a dynamic level weigh more in the overall analysis. Contrary, two or more reversal patterns at a classic support or resistance will confirm the reversal.
Finding Confluence Areas in Forex Trading
The problem with most technical analysis concepts is that they lack practical examples. We’ll try to overcome that by using as many examples as possible to illustrate the importance of confluence areas in Forex trading.
For instance, the chart below shows one of the most powerful and famous reversals in recent times. The USDJPY broke higher after the U.S. election showed Trump winning the White House.
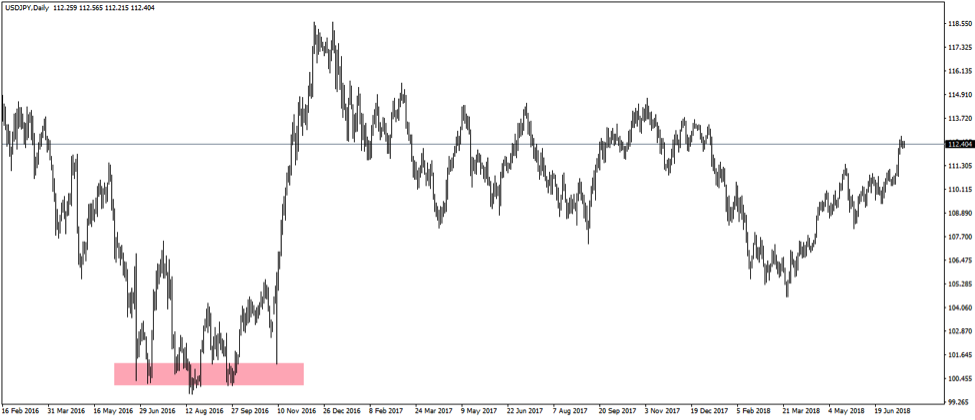
The market broke higher in an almost vertical line. After the initial disappointment, investors took a closer look at Trump’s presidential agenda, and the dollar exploded higher.
What’s interesting is the area where it bounced. Have a closer look at it, as it shows essential  characteristics.
Firstly, it took more than four months. In other words, there is no excuse to miss the price action and the potential reversal patterns that formed there.
Secondly, remember that confluence areas in Forex trading aren’t just given by trendlines and channels. Instead, such areas form when the price finds it difficult to advance or decline regardless the reason.
Triple Bottom at a Confluence Area
The first thing to note is a triple bottom that formed at the highlighted area. Forex traders have a saying: “triple tops and bottoms rarely hold.”
Well, in this case, it held, and it is a pattern representative for the currency market.
The original concept of a triple bottom calls for the price to hesitate at the same level. However, this is difficult in today’s Forex trading due to the heightened volatility levels and five-digit quotations.
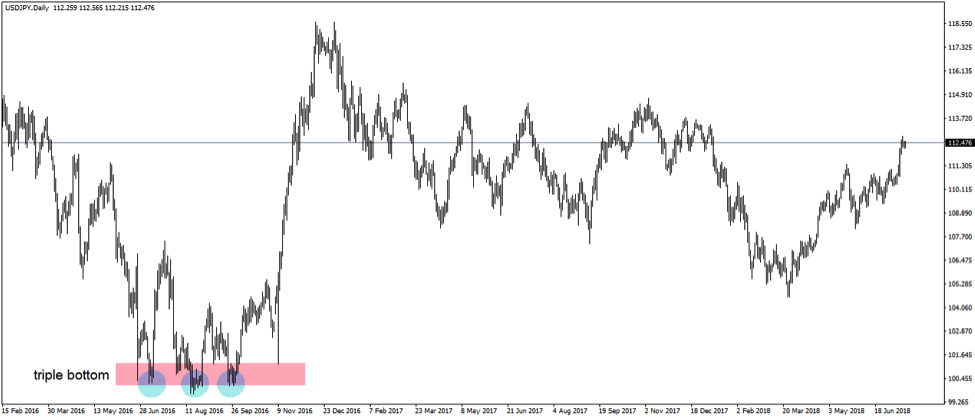
As mentioned earlier, confluence areas in Forex trading have more than one factor pointing to the same direction. In this case, the first thing to note is the triple bottom.
Triangle as a Reversal Pattern
Traders familiar with the concept of a triangle quickly noticed the pattern. As a reminder, in a triangular pattern, the market forms a series of lower highs or higher lows until eventually breaks.
In this case, the triangle becomes obvious by simply connecting the triple bottom and highlighting the lower highs. The resulting trendlines converge, showing a beautiful contracting triangle that acts as a reversal pattern.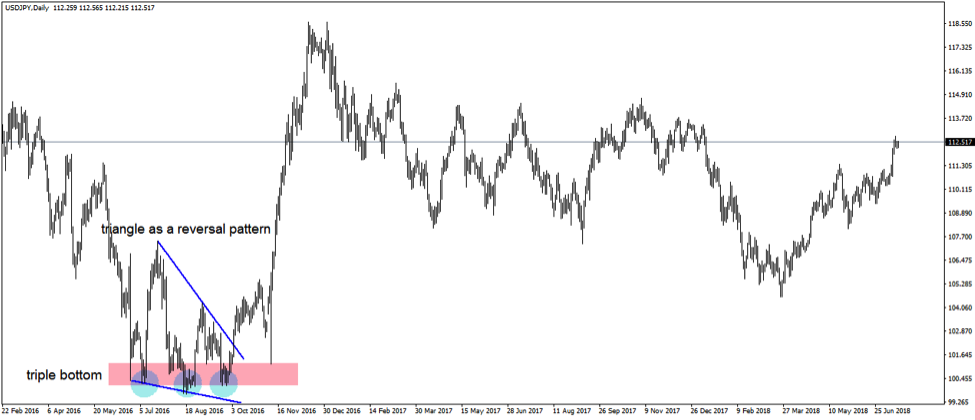
Just like that, two reversal patterns formed at the same area. Hence, bulls had all the time in the world to prepare for a trend reversal.
What would be the best trading strategy in this case? Well, the idea is to wait for the upper side of the triangle to break. The so-called b-d trendline signals the end of the triangular formation.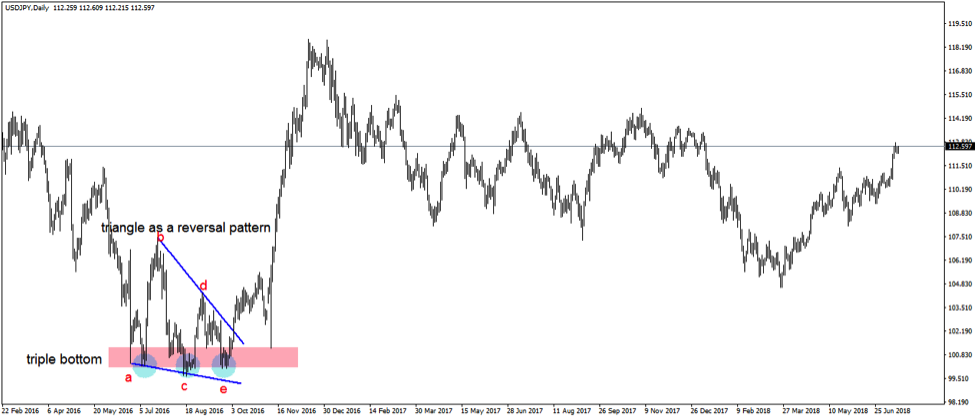
This is particularly important in the case of the USDJPY chart from above because the break of the b-d trendline comes after the market put a triple bottom in place. Confluence areas in Forex trading reinforce a trading decision.
Therefore, by the moment the price broke the b-d trendline higher, traders not only had a signal to go long but the market signals the start of a bullish trend.
Steps to Trade Such Confluence Areas in Forex Trading
Here are the steps to trade such a confluence area based on the two patterns formed:
- wait for the price to break the b-d trendline
- place a stop loss at the last push on the triple bottom pattern
- target a risk-reward ratio of minimum 1:3 for the trading setup to make sense
- or target the longest measured move of the patterns part of confluence areas in Forex tradingthe triangle’s measured move is seventy-five percent of its longest segment (wave a) projected from the b-d trendline’s break
- the triple bottom’s measured move is the highest bounce projected from that point (wave b’s length projected from the wave b’s high)
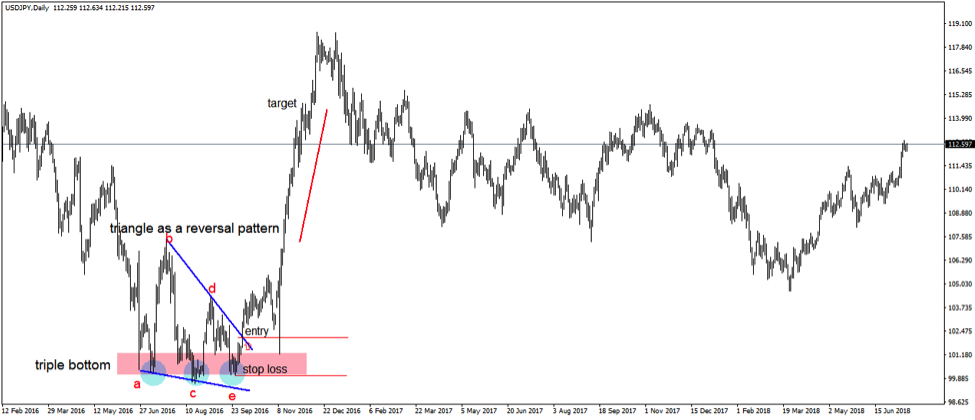
Between the two measured moves, the one that belongs to the triple bottom is the longest, giving a target that shows a much bigger risk-reward ratio than the desired 1:3.
What’s more important to such confluence areas in Forex trading is that they effectively tell the fundamental story. Because the break of the b-d trendline happened BEFORE the U.S. election, many thought the other candidate would win.
However, the risk-off sentiment associated with Trump’s possibility to win quickly dissipated, making room for a strong advance. Put it just, the USDJPY broke on risk-on and advanced on market participants realizing the potential.
Psychological Levels Part of Confluence Areas in Forex Trading
Besides classic support and resistance areas, psychological levels in Forex trading come to complete the picture. Look for round numbers to influence levels due to the human nature tendency to enter or exit at round numbers.
In this case, the 100-mark proved to be a terrific support for the USDJPY pair.
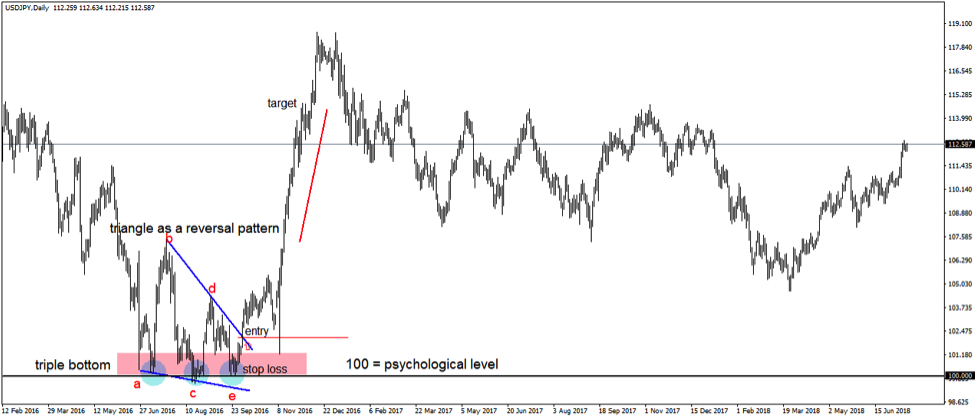
In other words, the price built the triple bottom on the psychological one-hundred mark. At this time, the confluence area had:
- one triple bottom
- a contracting triangle as a reversal pattern
- one psychological level
Was there anything else to consider that can support confluence areas in Forex trading like this one?
Japanese Candlesticks Reversal Patterns
Because of the triangle and the triple bottom are reversal patterns, any other reversal pattern comes to help. Hence, in such an instance, look for Japanese reversal patterns around the psychological level to reinforce the bouncing potential.
Such patterns are:
- morning stars
- Doji candles
- hammers (a.k.a. pin bars)
- piercing
- bullish engulfing
- inside bar
Japanese candlesticks patterns are known for taking very little time to form. All the patterns listed above take one, two or maximum three candlesticks to form.
Hence, they provide a quick bias over the future direction, while the classic technical analysis patterns (e.g., the triangle and the triple bottom) keep forming. To spot the Japanese patterns, traders need to “dig in.”
More precisely, to zoom in and scrutinise the area.
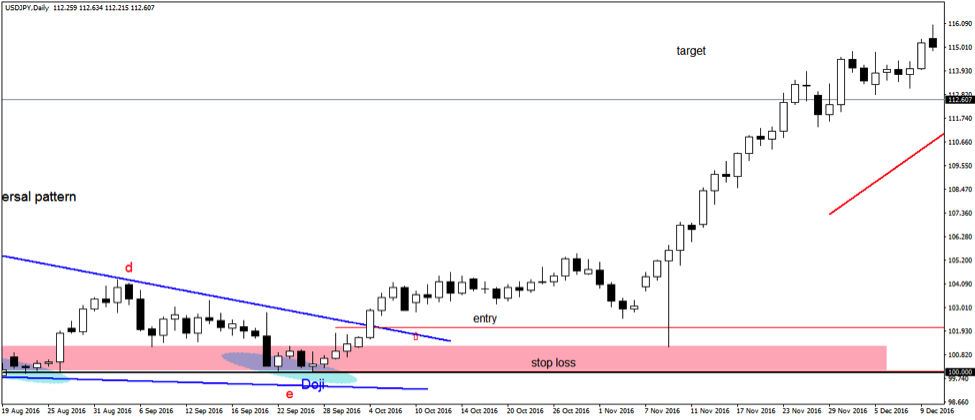
A quick look reveals a Doji candle is forming right towards the end of the last triangle’s segment. That’s a very powerful reversal patterns belonging to Japanese candlesticks. When it forms during confluence areas in Forex trading, it further strengthens the forecast.
As the majority of my followers know, I am strictly a price action trader and you can find more about my trading strategy HERE
Fundamental Analysis to Complement Confluence Areas in Forex Trading
While technical analysis gives the direction, the fundamental analysis offers the reason why the market moves. Many believe that one without the other just doesn’t work in Forex trading or investing in general.
Before important economic data like the NFP (Non-Farm Payrolls) markets take the time to consolidate. But markets also consolidate before critical political events, like the U.S. election.

For the entire summer, no trader wanted to take a chance on the dollar. Everyone looked at polls and how Hillary or Trump performed.
As it turned out, any indication that Clinton will win the election was associated with a risk-on move. More precisely, with the USDJPY moving higher.
Hence, the break higher above the b-d trendline came as a fundamental reaction to a risk-on move. Or, it came to complete the technical picture.
Confluence areas in Forex trading that combine the technical and fundamental picture are difficult to ignore. In fact, traders look for both to complement the original trading scenario.
Support and Resistance Using the Apex of a Contracting Triangle
The secret to finding confluence areas in Forex trading is to know where to look for them. In the example used so far, the psychological level is enough to spark an interest.
As such, traders waited to see the market reaction on the psychological level. Next, they waited for potential reversal patterns to form. And it did: triple bottom, triangle, and the Doji candle.
 Finally, they WAITED for the b-d trendline to break higher on fundamental analysis confirmation. Therefore, the trade opportunity was a result of a combination of factors aligned at a confluence area.
Now that the market bounced from the psychological level (all of them are horizontal – hence, they offer classic support and resistance), where should the focus be? The answer comes from the left side of the chart.
Traders use the info given by previous patterns and project levels on the right side of the chart to find areas where the price might hesitate. Yes, might, because nothing happens with absolute certainty.
Important: This is why all trades must have a stop loss.
Using the Apex of Contracting Triangles to Find Confluence Areas in Forex Trading
Wonderful technical analysis patterns, contracting triangles often appear in the currency market. Traders use them as either continuation or reversal patterns, focusing on the moment when the price breaks the b-d trendline.
However, that’s info related to the actual trading.
But triangles also project future support and resistance levels. That’s especially the case for triangles that act as continuation patterns.
Traders using this method use the apex of a contracting triangle that served as a continuation pattern to project future support and resistance levels.
Because the area is known in advance, traders use such places to find confluence areas in Forex trading.
The same USDJPY timeframe saw an earlier contracting triangle that broke higher. Therefore, it acted as a continuation pattern.
Following the Bank of Japan (BOJ) decision to buy JGB’s (Japanese Government Bonds) in a process called quantitative easing, the USDJPY broke higher. The triangle forming around the 120-level proved to be a great continuation pattern.
Speaking of triangles as continuation patterns, in the Elliott Waves Theory, they form only as:
- 4th waves in impulsive moves
- B-waves in zigzags
- X-waves of various degrees
Therefore, if one uses the Elliott Theory to count waves, the brown triangle can be only one of the three waves mentioned above.
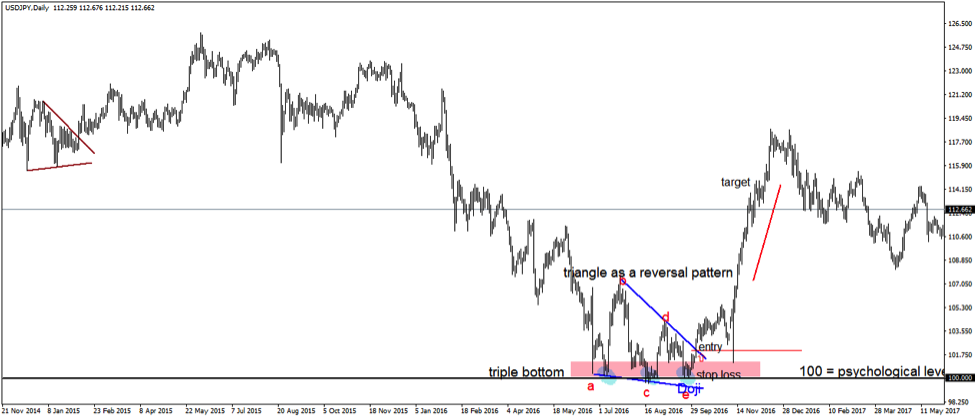
The apex of a contracting triangle is the intersection point of the two trendlines that form the triangle. More precisely, if the triangle is labeled a-b-c-d-e, the apex point sits at the a-c and b-d intersection.
Technical analysis concepts tell us the apex offer strong support and resistance levels are moving forward. That is the area of the apex, not exactly the level.
Hence, when the market broke higher from the confluence area discussed in this article, traders already had an educated guess where it might hesitate. You’ve guessed right: at the area given by the apex of the previous contracting triangle.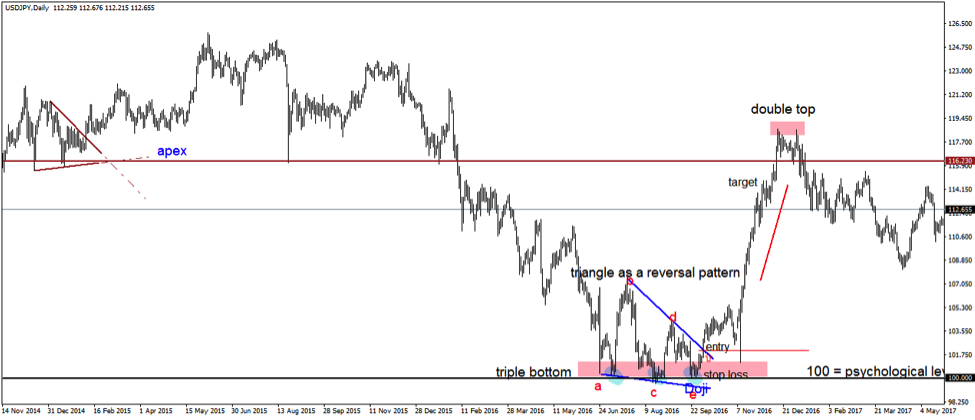
The brown line in the chart above shows the apex’s level. It remains there on the chart to act as a support or resistance for future price action.
In this case, as the market shot higher from the previous confluence area, savvy traders waited for the reaction at the possible resistance. Even the most bullish traders booked some profits when the price reached the apex.
What if it turns?
Because of the relative big timeframe (this is the daily chart), there is plenty of time to look for elements part of a confluence area. The process is similar to what we’ve discussed so far in this article.
Namely:
- use a horizontal area that has chances to offer support or resistance
- look for classic reversal patterns around the area
- zoom in to find out possible Japanese reversal patterns
- position according to the findings
Not only that the market formed a double top around the apex of the contracting triangle, but it also created a shooting star at the second swing that marked the double top.
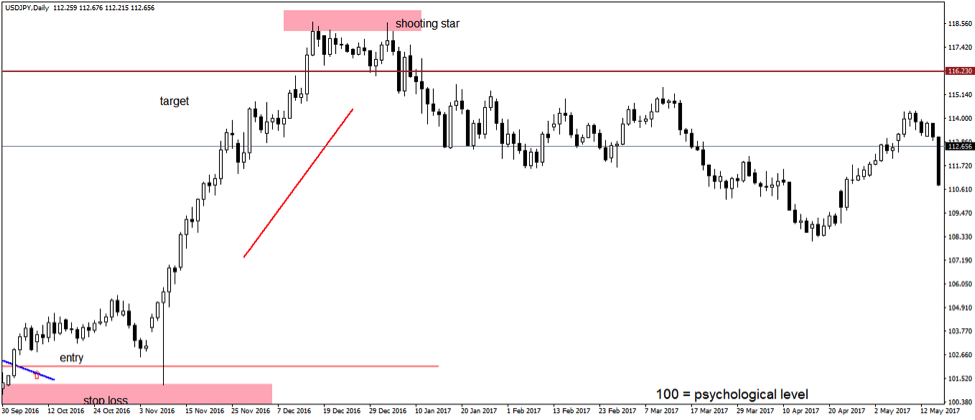
So, there you go, three elements coming together in the same area:
- the apex of the contracting triangle
- double top
- shooting star
It is impossible to remain on the long side with all this in place on the daily timeframe. Therefore, the focus shifts on how to trade on the short side from this moment on.
As it turned out, the market reversed quite aggressively, almost reversing the entire move higher caused by the U.S. Presidential elections.
Conclusion
Confluence areas in Forex trading are for traders that like to plan their trades carefully. They look for more than one element to confirm their bias.
In the first example used in this article, the bias was bullish. The one-hundred level was supposed to attract the price, and it did.
Next, traders looked at what kind of patterns form around the classic support level. It turned out the market formed reversal patterns, so the bullish bias was confirmed by the price action.
The second example used the same approach to finding short trades as the apex of the contracting triangle proved to be strong resistance.
The reversal patterns part of confluence areas in Forex trading give traders the rules to trade such areas.
As all reversal patterns have a trading strategy behind them, traders know what to do and how to trade confluence areas in Forex trading.
As you are aware, I am using a strictly price action trading strategy, which incorporates the market element like no other strategy.
p.s.
If you have enjoyed this article, you might as well like to check out my article about Candlesticks
If you want to continue your learning experience, check out my professional trading course