


The Most Comprehensive Guide On The Types of Trendlines And How To Use Trendlines

Contents in this article
- What are trendlines
- Trendlines and FOREX traders
- Trendlines and candlestick charts
- Trendlines and line charts
- How do we know which trendlines are valid
- Do I connect a high with a high or a close with a close
- Of slopes and angles?
- Trendline re-test
- Other ways to use trendlines
- Types of channels
- Other types of channels
- Summing it all up
The Most Comprehensive Guide On The Types of Trendlines And How To Use Trendlines
by: Colibri Trader
So, what are trendlines…
Trendlines are probably the most widespread tool in technical analysis. I have written a comprehensive article on Support and Resistance, which I highly recommend you starting with.
Trendlines are actually lines of support and resistance. There are various types of trendlines and different traders use them differently.
In the end, trading is more of an art than a precise science. That is why it is very hard to be precise when it comes to defining trendlines.
Trendlines and FOREX traders
Another very common characteristic amongst traders is that they don’t know how to draw them correctly. Inexperienced traders are trying to make the market fit their trendlines. Alas, it should be the other way around.
Trendlines and Candlestick Charts
As you can see in the image above, trendlines could be of different angle and magnitude. What is common between all of them is that they are connecting the lows or the closes of the candles.

BONUS: CLICK HERE & GET FREE CANDLESTICK E-BOOK
Trendlines and Line Charts
Trendlines could also be drawn on line charts. As you can see from the image above, lines could be used for connecting the lows and the highs when establishing a trendline.
How Do We Know Which Trendlines Are Valid
A very good question a lot of traders are asking is how to verify a trendline. A rule of a thumb says that a trendline is valid if and only if price has touched it three times.
This means that you should have at least three lows or three highs connected with a straight line to verify the validity of a trendline
How Do I Know Whether to Connect Lows or High? How Do I Draw a Trendline
A lot of times new traders are confused which three points to connect with a straight line. There is a very simple answer to this:
Uptrend=Lows
Downtrend=Highs
In other words, use trendlines to connect the lows in an uptrend.
On the other side, during downtrends, use the highs to establish a trendline.
If it is still hard to remember, just try to think of it this way: When you are in a downtrend, you are trying to “short” the market. Ideally, you will be looking to enter in a trade after a retracement.
Therefore, you will need to see price rising, establishing a high and then going lower again.
At places like that, you will be looking to start drawing your trendlines in a downtrend. For a better visualization, have a look at the drawing below.
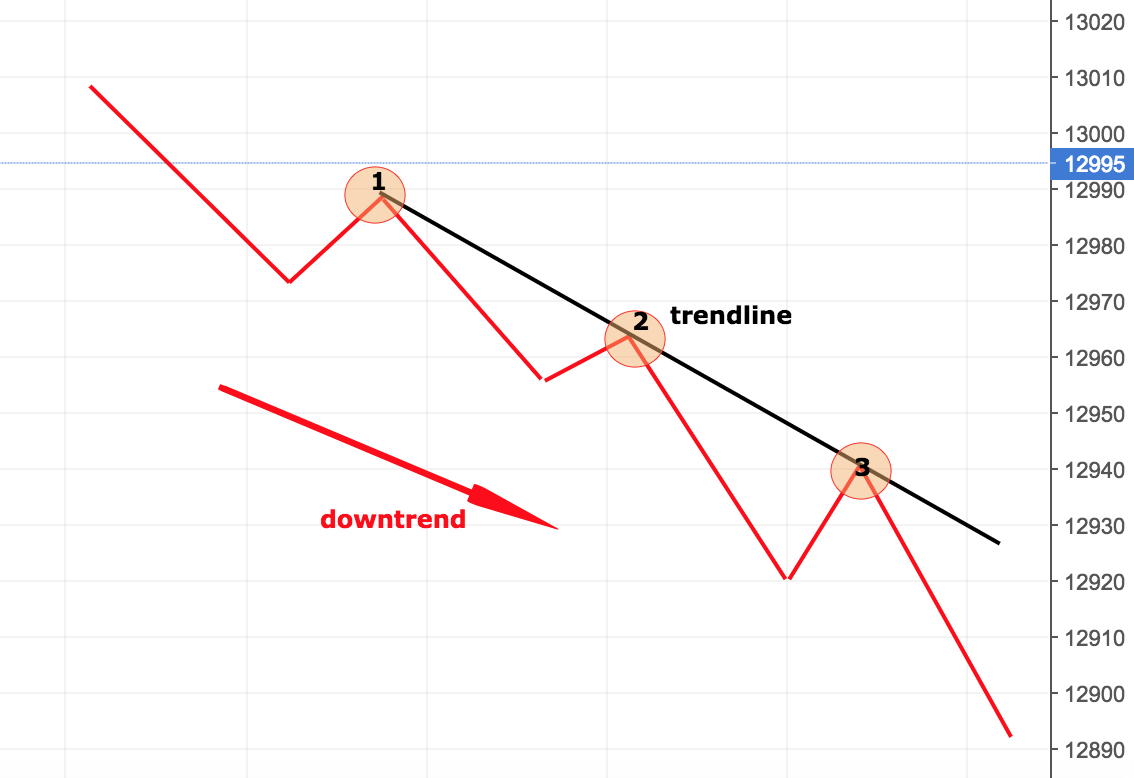
Places like #1, #2 and #3 are where you should be connecting with a straight line. Once the line is drawn, your trendline is in place. It is as simple as that.
Do I Connect a High with a High or a Close with a Close
A lot of traders are confused when it comes to drawing a trendlines properly. One of the most commonly asked questions is whether you should connect the highs or the closes on a candlestick chart.
It is a very good question that a lot of times leads to heated disputes amongst traders. In my opinion, it should be a mixture of both.
Since technical analysis is not an exact science, it does involve a bit of art in it.
When drawing trendlines, I am myself using a mixture of both. Let’s have a look at the example below:
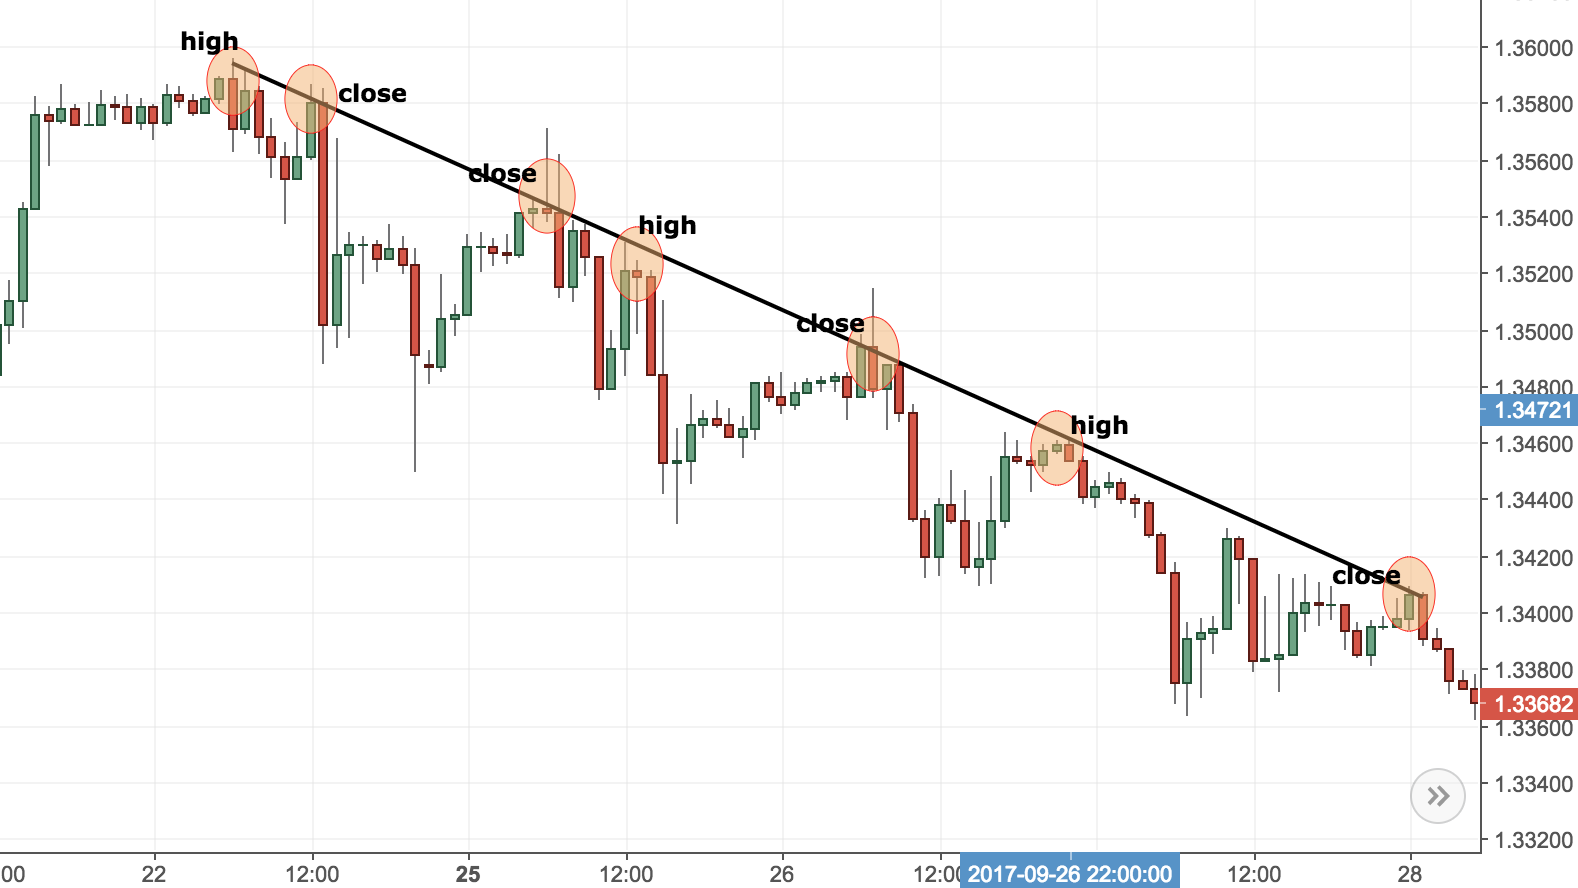
As you can see from the image above, the downsloping trendline was drawn by connecting highs and closes. There are three highs and 4 closes that were connected for a total of 7 points on the chart.
In my opinion closes are more important and they carry more meaning. If a candle closed at a certain level that means that market participants were ready to accept this level as a market equilibrium.
On the other side, highs/lows are the maximum/minimum they were willing to pay over a certain time period.
Thus, closes are the places where the majority of traders agree on a certain price level, which makes the level more significant. Nevertheless, for a trendline, it is important to maintain the direction of the trend.
Traders should remember here that you should have at least three points connected with a straight line to form a trendline.
Of Slopes and Angles
Another popular concept of trendlines is the slope or the angle.
It is believed that when a slope has a greater degree, the trend is stronger.
On the other side, when the slope has a smaller angle, the trend is weaker.
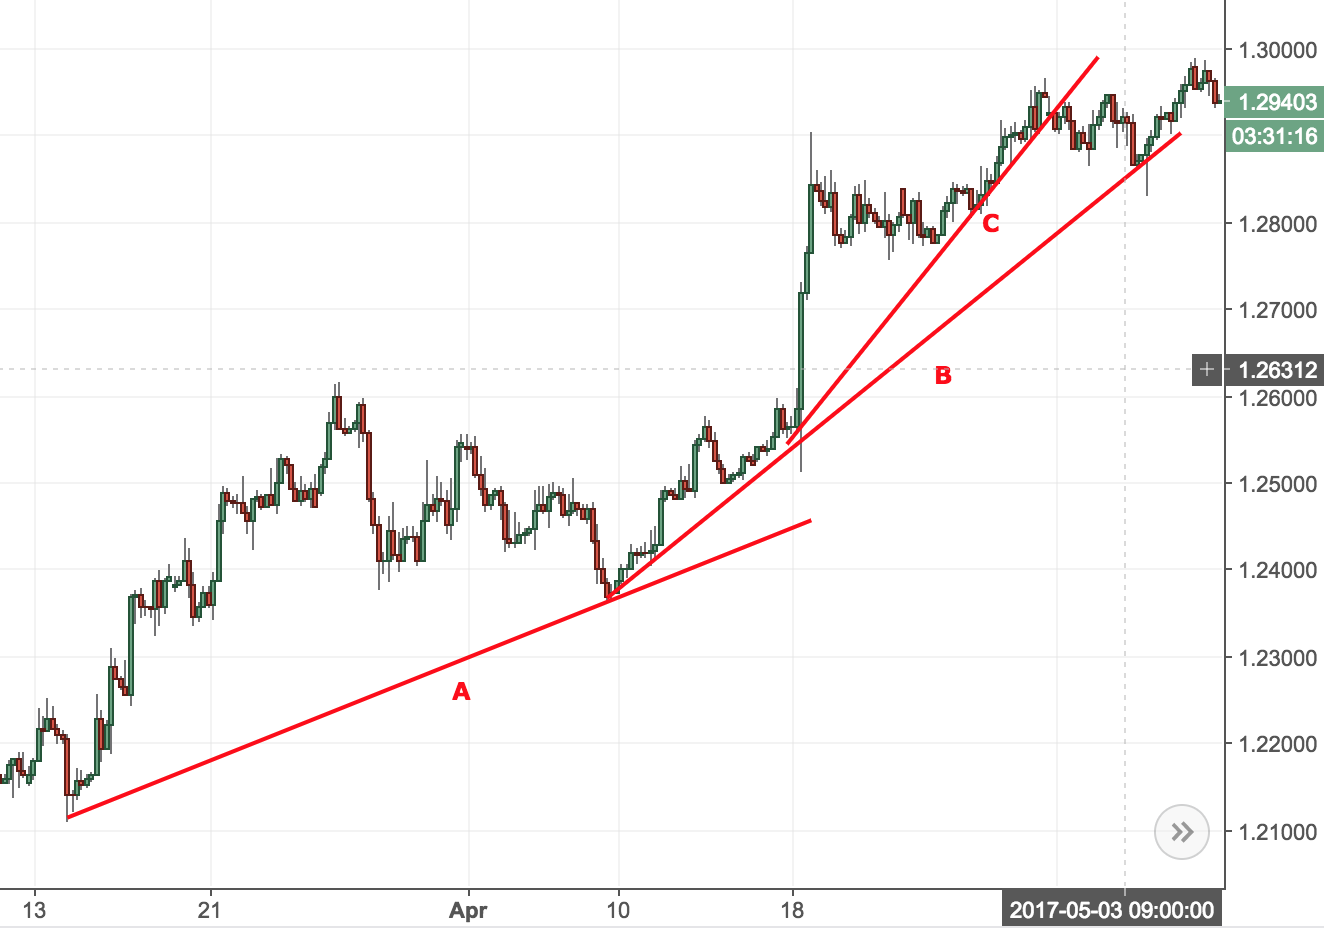
Although overly simplistic, this definition holds a certain truth in itself. If you think about it for a second, when a trend is rising, if the slope is sharper, that means that market participants are buying faster and are more eager to hold a certain security. Look at the image below:
It shows 3 different trendlines. The first one has an angle of 45 degrees. It is the beginning of the trend and is sharper than the second one. That shows the readiness of the market participants to jump on that trade quickly.
 As time goes by, the trend settles down and the angle reduces. In the second trendline, you can see the angle is already 27 degrees. Market participants continue to be bullish, but at a more moderate rate.
As time progresses and the trend matures, more money starts exchanging hands and the angle increases even more. The third trendlines shows an angle of 62 degrees, which is the greatest of all.
By definition the beginning and the end of each trend is marked by sharper market moves. That is exactly what the example above exhibits.
Other Examples of Trendlines That Don’t Define the Trend
Trendlines could be used to define patterns. For a very detailed article on such patterns, check out Contracting Triangles. You can even download a free guide with many examples.
Trendlines are great for defining market turning points. In the example below, you can see one such case:
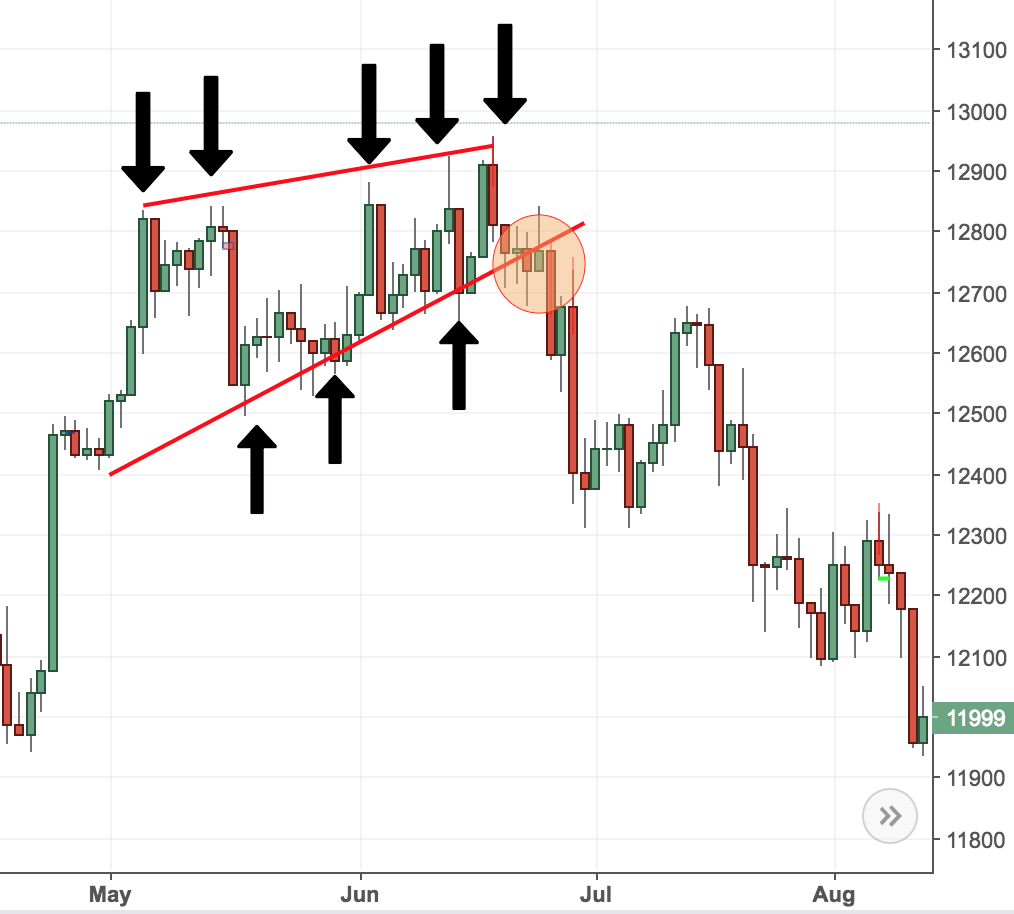
You can see that two trendlines were used to delineate a chart pattern also known as a raising wedge. After price breaks below the lower trendline, the trend changes.
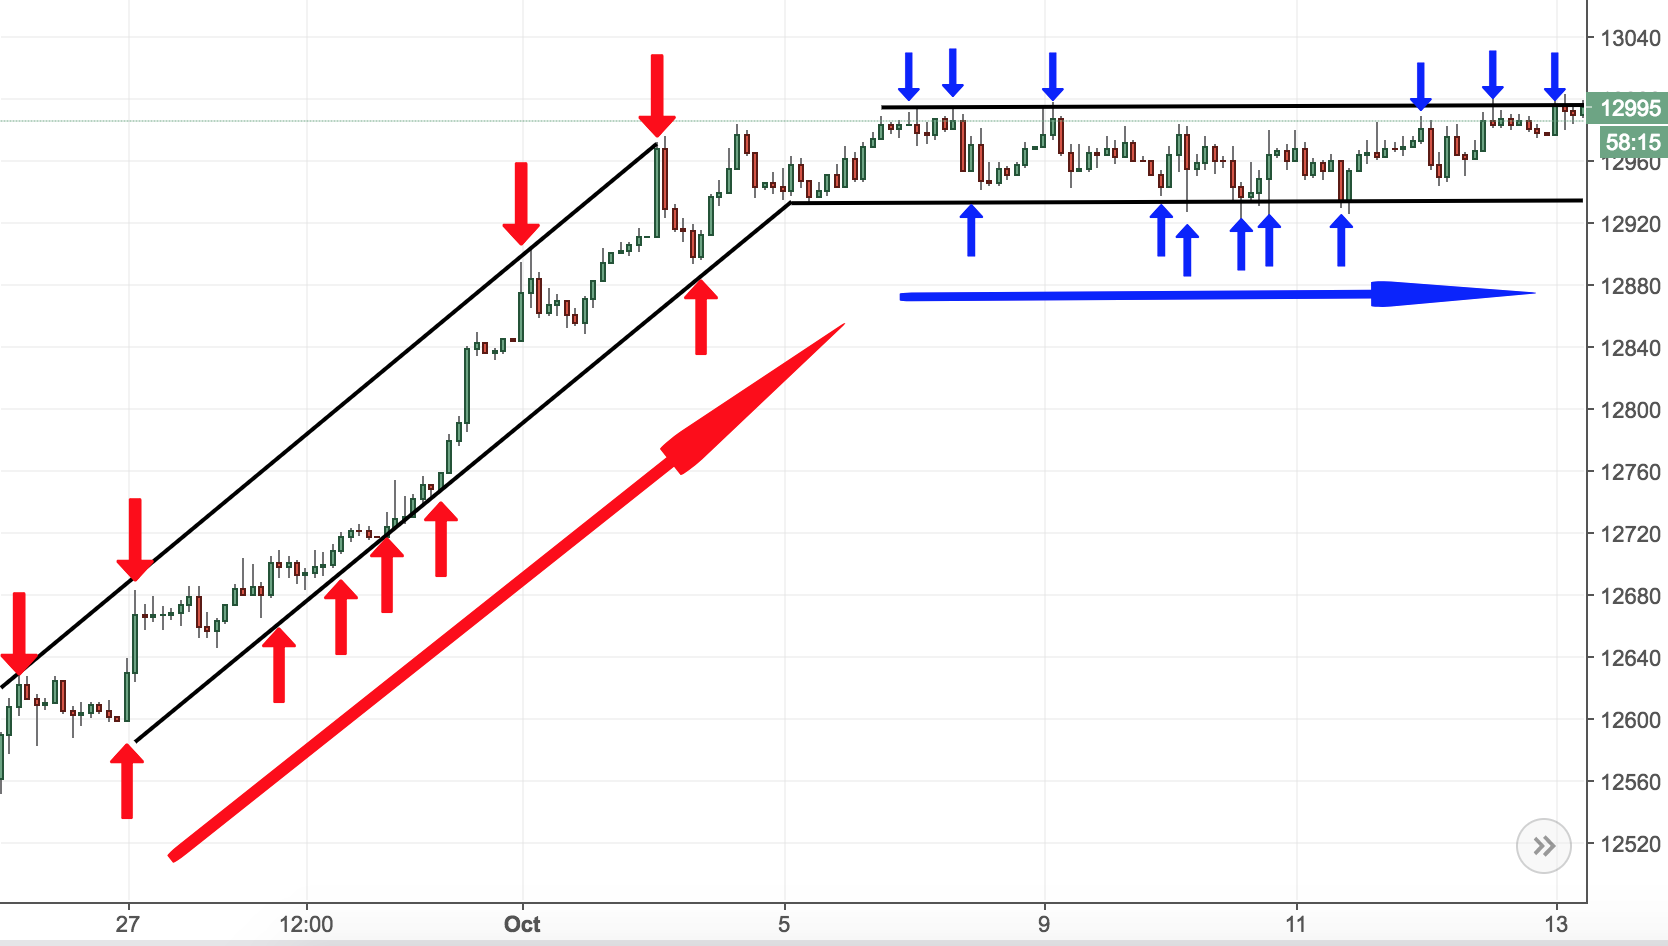
Trendlines could also be a powerful predictor of trading breakouts. In the example below, a single trendline was used to show an area of resistance. Once this trendline is broken, price shoots up higher to reach a new equilibrium level:
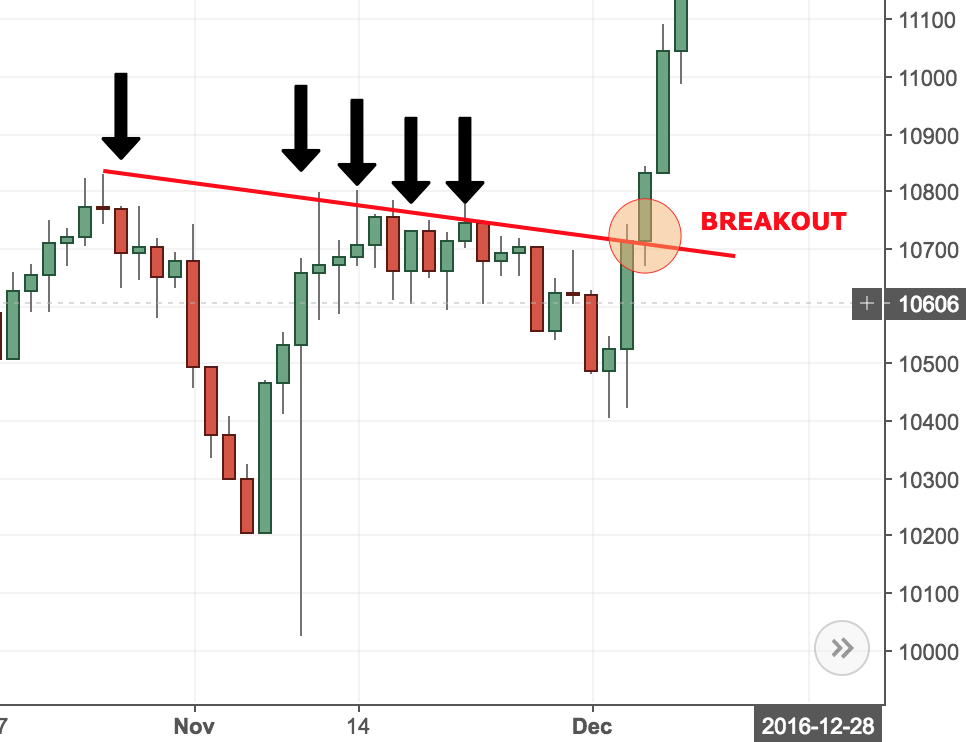
The breakout occurs after price tests the trendline 5 consecutive times. It is a quick breakout and price does not even re-tests the trendline. Usually, trendline breakouts are accompanied by a retest of the trendline.
Trendline Re-test
Usually single trendlines are broken, but also retested. Let’s have a look at another example…
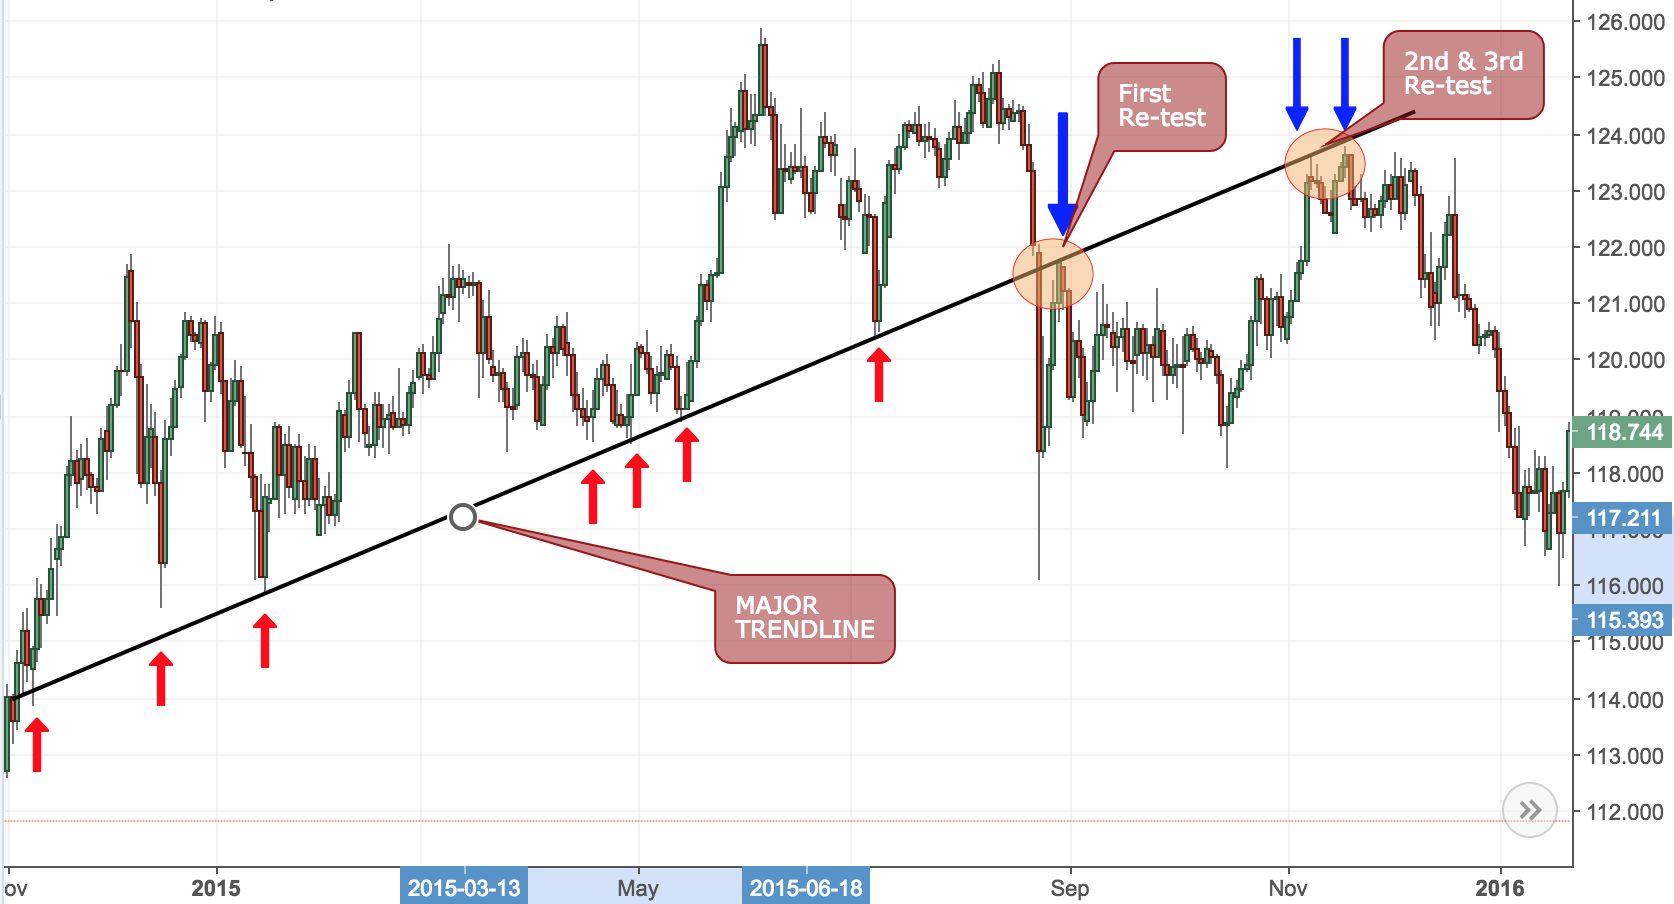
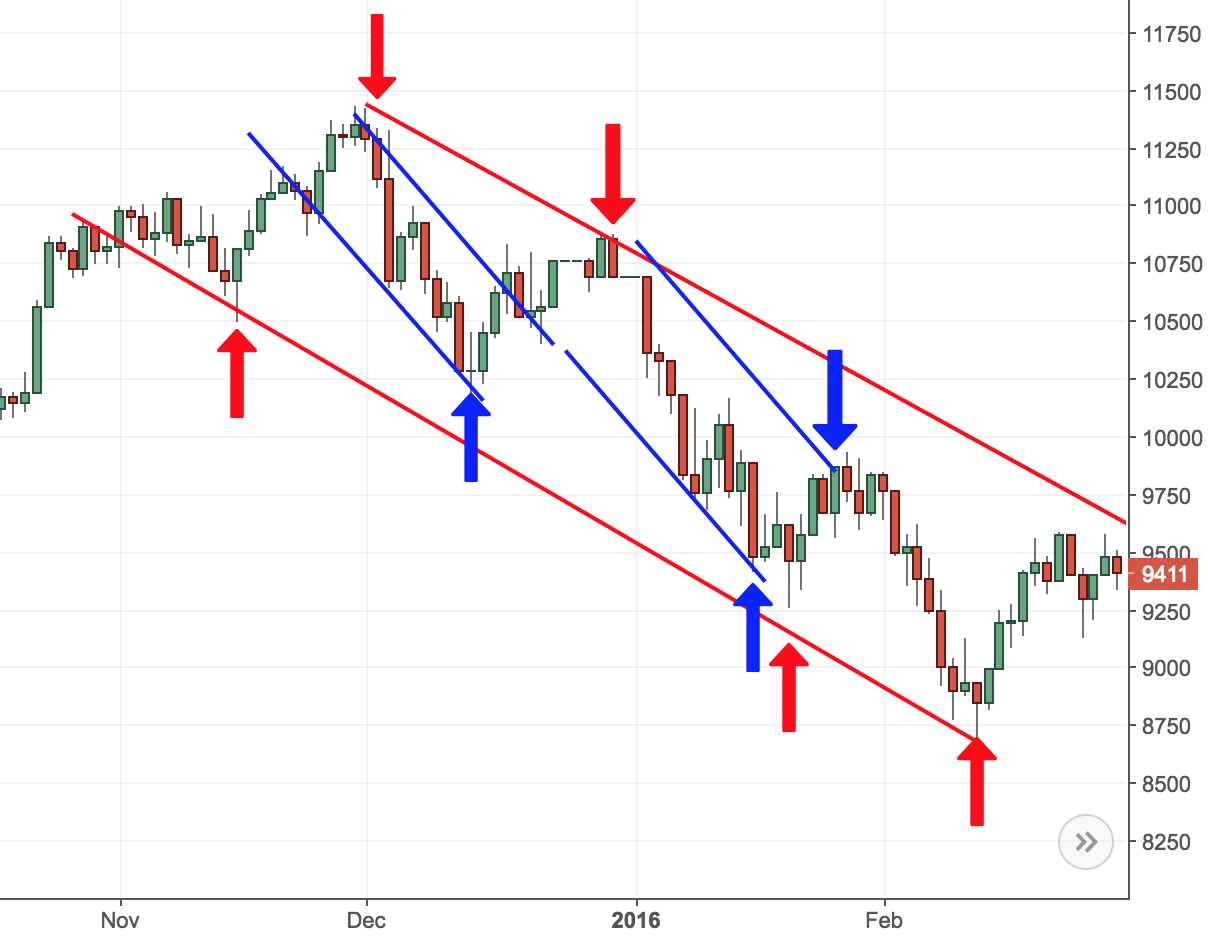
The example above is taken from the Daily chart of the USDJPY for 2015. As you can see the major trendline was confirmed multiple times.
The first breakout occurred in September, 2015. After price broke through this major trendline, it re-tested the major trendline a few times as marked by the blue arrows.
The sequence is as follows:
Other Ways to Use Trendlines
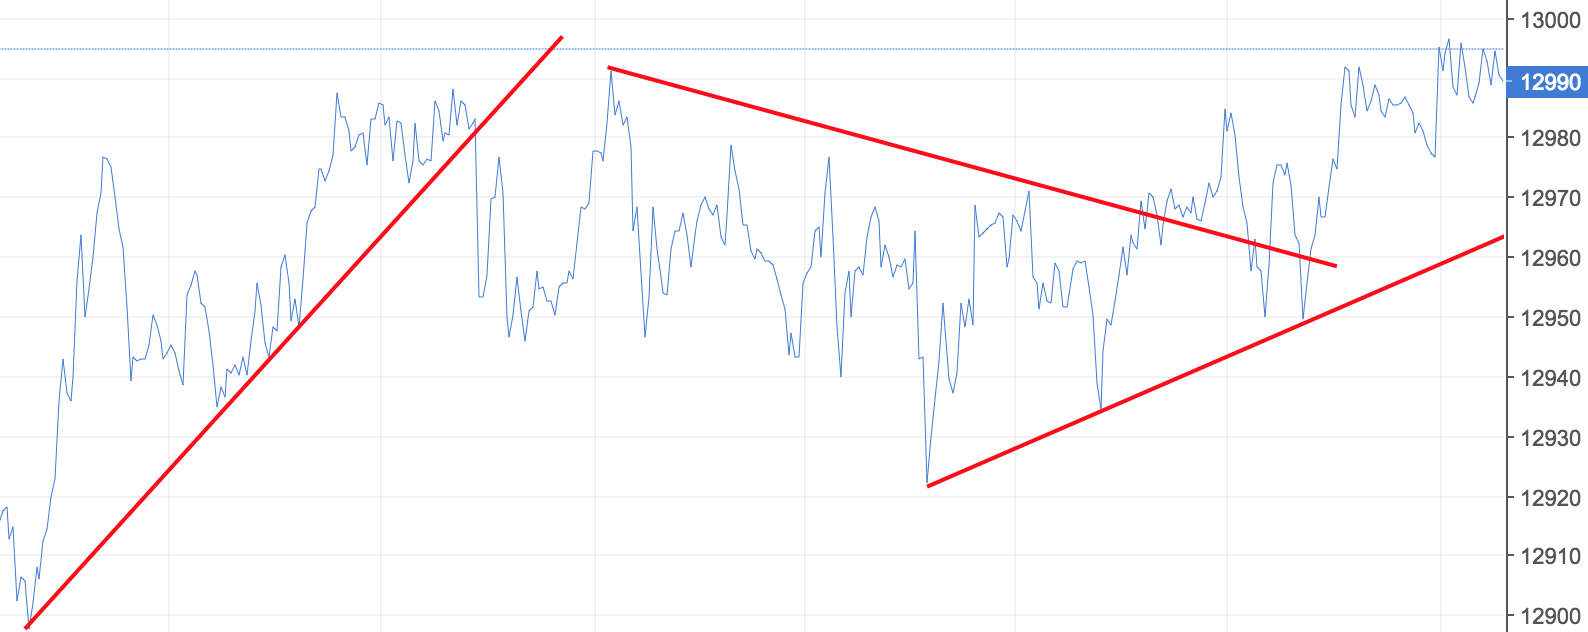
A very popular method to use trendlines is by combining two in a trading channel. Have a look at the image below:
In the image above you have two channels. In the next section, I will review them in more details. What is important to remember here is that price usually travels in channels that could be marked by parallel lines.
 Different traders will find different channels that might not be exactly identical to each other. The point here is to find your way of drawing channels. For me that way is by finding a trendline that has been tested multiple times.
Secondly, you need to draw a parallel line next to it. If it has been tested multiple times (as the image above shows) by price, then you have a valid trading channel.
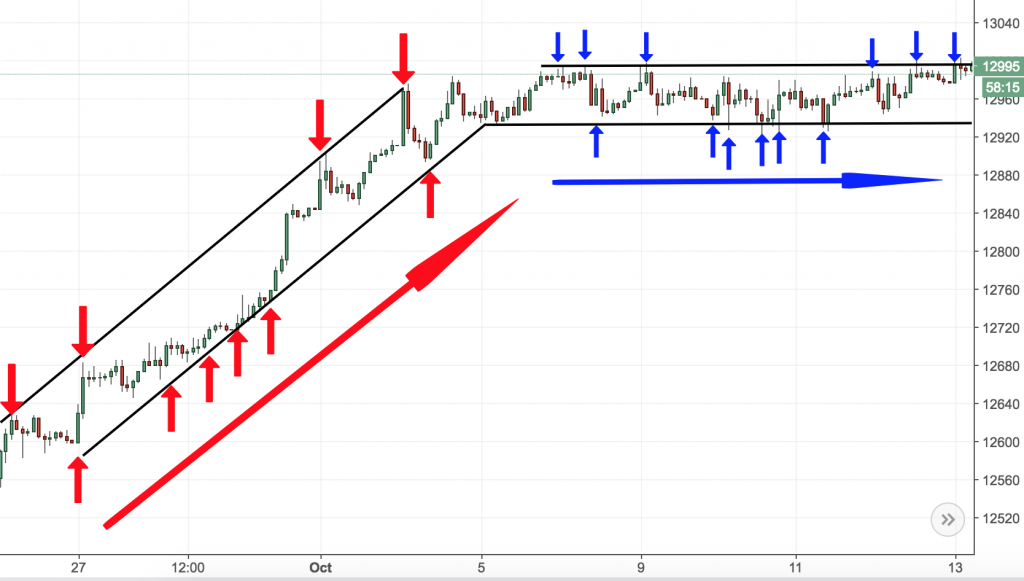
Types of Channels
There are two types of channels- Horizontal and Diagonal.
Horizontal Channels
Horizontal channels are two lines drawn parallel to each other. They usually connect the lows of the session and the highs (or closes) of the session.
As you can see from the image above that is the section above the blue arrow.
It looks like a channel and the price navigates inside locked between its upper and lower boundaries.
Diagonal Channels
The second type of channels is diagonal. They are shown above the red arrow in the image above.
The principle behind is the same. Price moves locked between two lines drawn parallel to each other. They are connecting the lows and highs (or closes) of the session and move upwards or downwards diagonally.
Other Types of Channels Using Trendlines
Other types of channels include channels within channels. Below is an illustration describing this concept more clearly.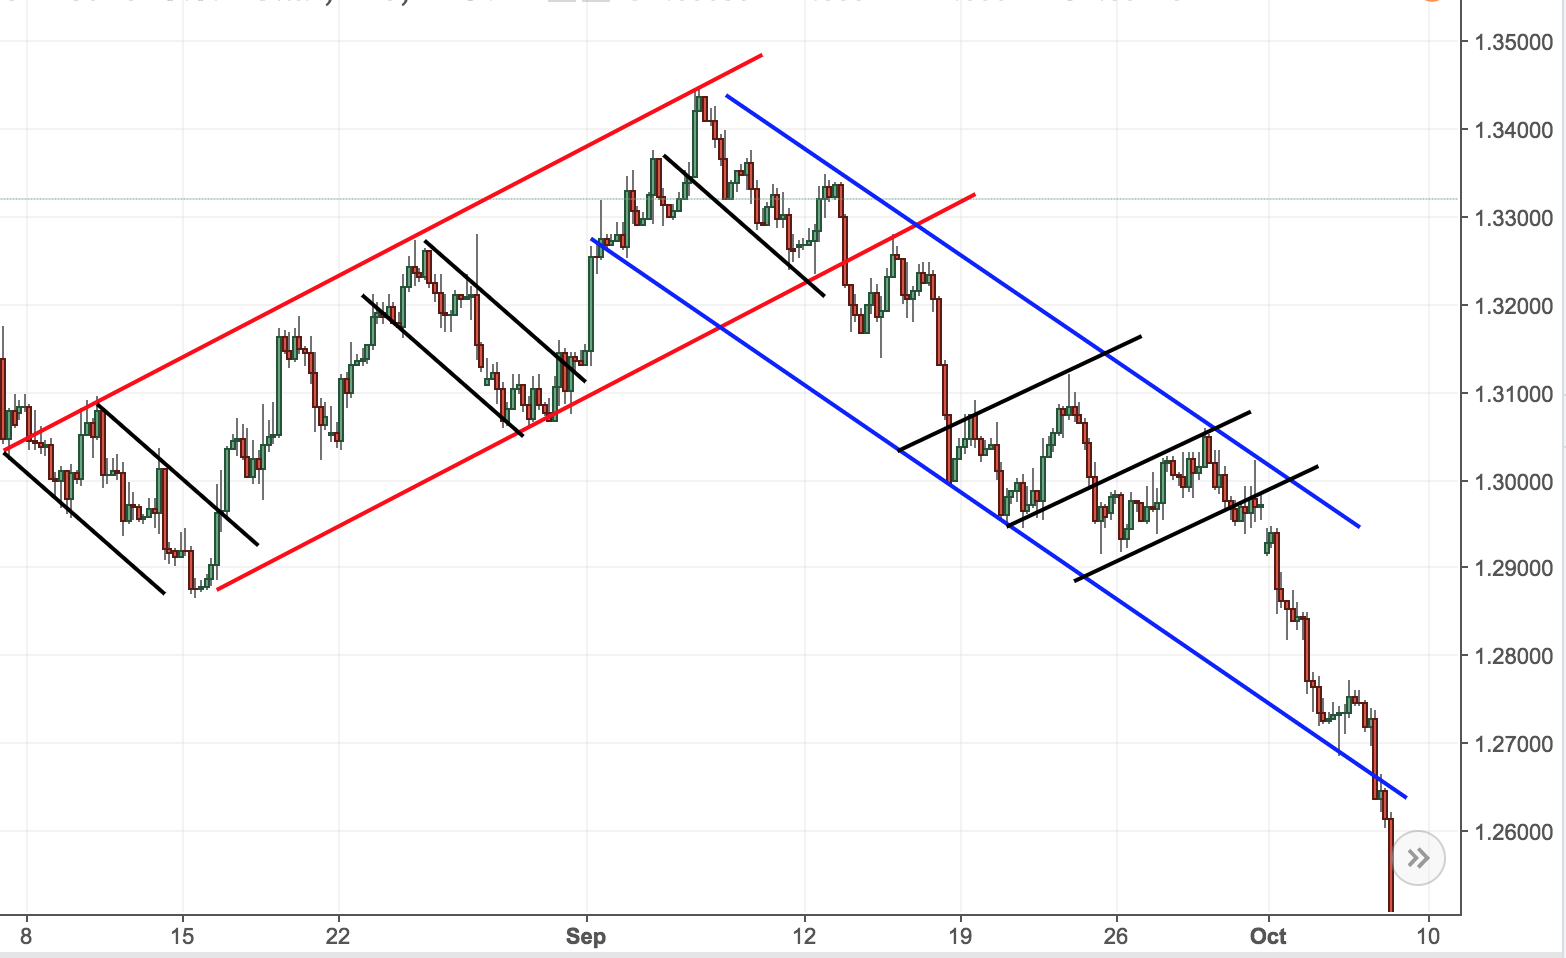
Perpendicular Channels
As shown above, channels within channels could be perpendicular. This means that if we have the major trading channel that is rising, price retraces inside another smaller “perpendicular” channel.
You can see from the image above two major trading channels marked with red and blue. Within those two major channels, there are 5 perpendicular smaller channels.
Again, this is a confirmation that price moves in channels. Let’s have a look at another type of trading channels.
In-Line Channels
Another less popular type of trading channels delineated by trendlines are the “in-line” channels. These channels move in tandem with the major trendline channel.
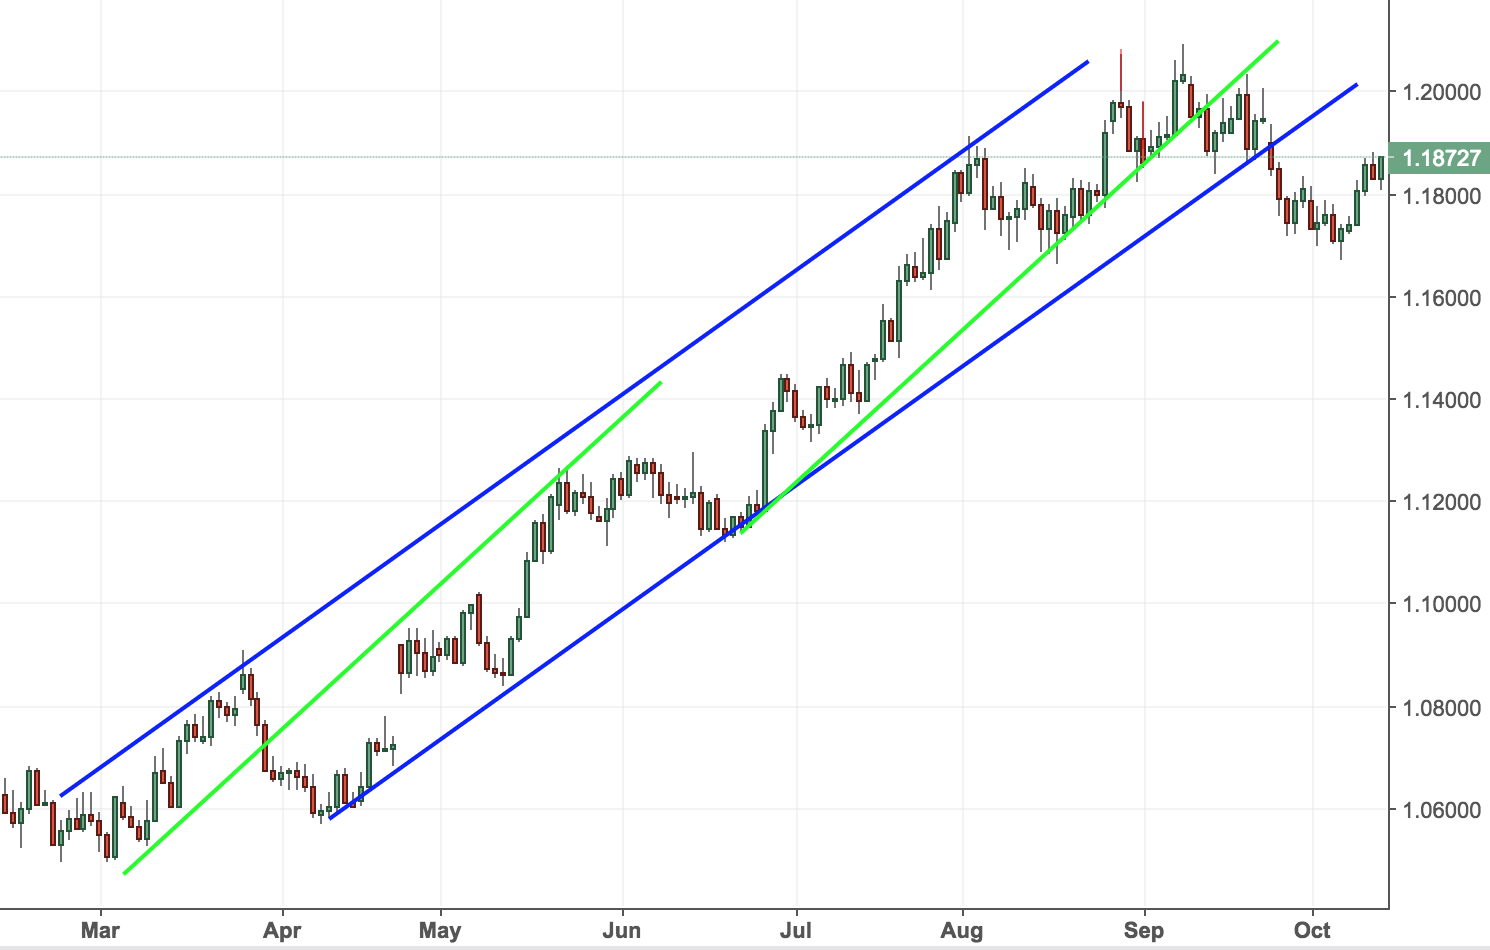
As you can see in the image above, there are two channels within each other. These are as I call them “in-line” channels.
They move parallel to each other and have both been retested multiple times by price.
Another example of an in-line channel is given below:
The angle in this example is greater than the previous one. In-line channels come in different shapes and variations.
It is important to remember here that technical analysis is as much science as it is art.
You should not take anything for granted. Instead, you should be trying to understand the concept behind the words and the examples and build your own model just like I have done myself.
Summing It All Up
Trendlines are probably the most famous technical analysis tool.
As the article has shown, there are various ways trendlines could be used and unfortunately there is no single way to draw them.
After reading the whole essay on how to use trendlines, you should already be more confident of this important concept.
If I need to summarise trendlines in a few bullet points they would be:
- Use trendlines to define trends (bullish& bearish)
- Trendlines are formed by connecting at least three levels (high, low or close)
- Trendlines come in different variations and lengths
- Trendlines are great for identifying areas of support and resistance
- Trendlines have different angles, which confirm the strength of the trend
- Trendlines could be used on different types of charts
- Trendlines are one of the major technical analysis tools
Happy Trading,
Colibri Trader
p.s.
Check out the way I see the market in even more details
Or How I See Money Management and why it is one of the most important aspects of trading
For everything else, let me know at- admin@colibritrader.com
Excellent article, would be interested to see articles on different chart patterns.
Hi Rahul- which ones specifically?
Thank You
Totally my pleasure! Let me know if you have any questions
My pleasure, Milan!