


Bull Trap or One of the Most Useful Trading Patterns I Have Used
Bull Trap or One of the Most Useful Trading Patterns I Have Used
It is a paradox how useful the bull trap for traders could be and how little it is talked about.
There is so much that can be written about this pattern and yet it still is one of the least well-known amongst traders.
Bull trap or bear trap could be viewed as a failed attempt for a breakout. Check my article on breakouts HERE.
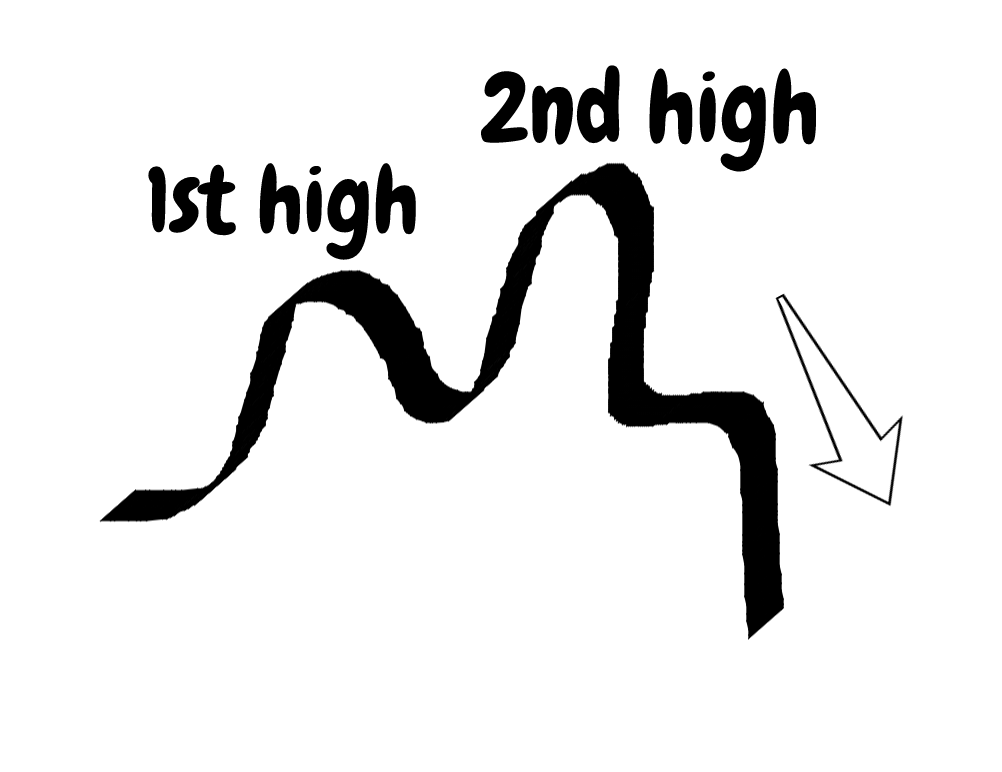
Bull traps might also be viewed as places where price is divergent. In other words, there are two highs where the second one is failing to hold higher and eventually pushes the price to a new low.
This is illustrated in the picture below.
Now, let’s have a look into a real-world example. Below is shown the daily chart of EURUSD.
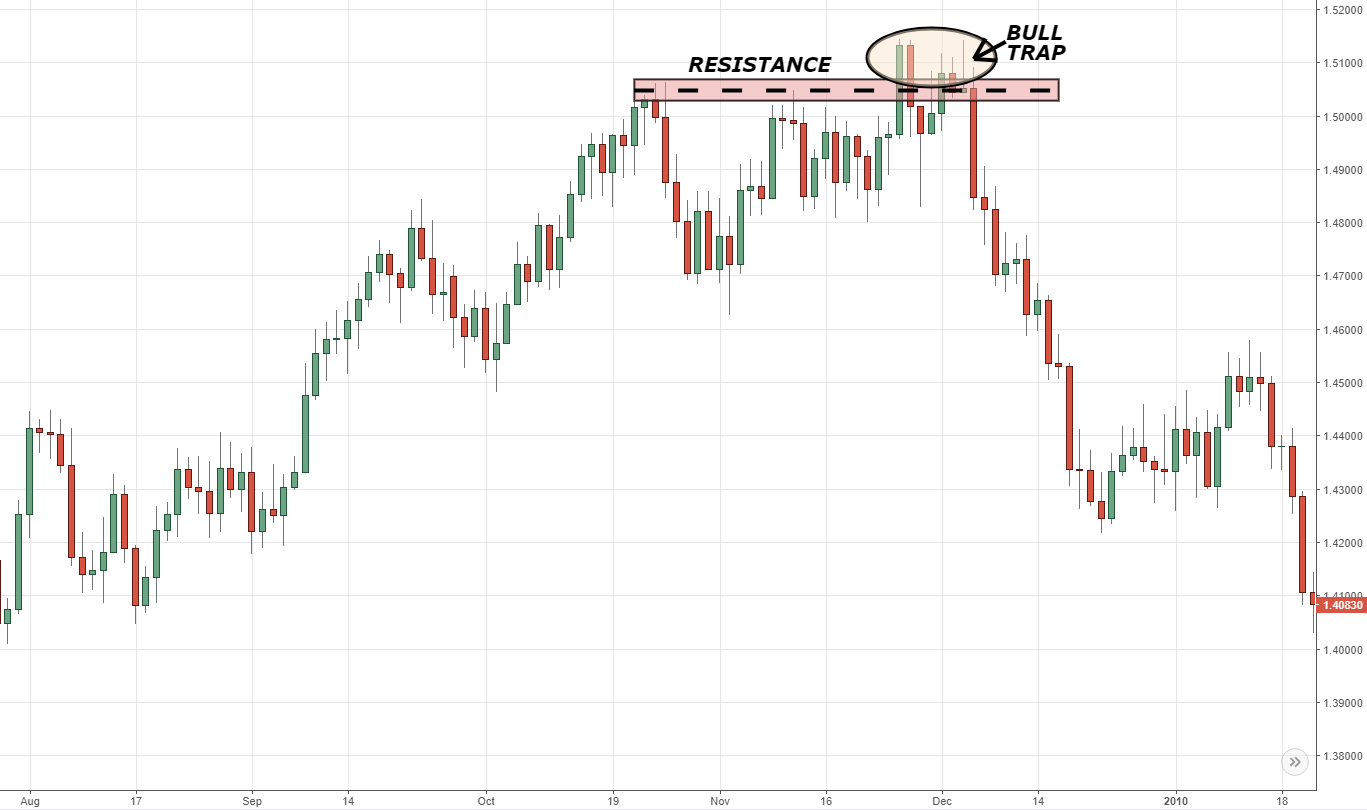
The majority of market participants will be looking to buy around the 1.5000 level. All the required conditions are met- major uptrend, a small retracement before the breakout, even a confirmation from price action in the form of a bullish engulfing candle just before the breakout.
An experienced trader might have not fallen in this “bull trap”, but the majority of retail traders do actually love to trade breakouts.
Trading breakouts are very easy to fall in love with.
They are simple and thus do not require a lot of guess work.
Breakouts are also logical, although not so efficient.
Human nature does not like to question probabilities and as such falls into the trap of believing the obvious.
One of the reasons I do not like to trade breakouts is because there is a lot of guesswork involved. Traders stop reading the market and fall prey to bad habits and even worse- lose in trading.
After such a long introduction, let’s have a look into what this article is about: bull traps and bear traps.
Bull Traps
So, what are bull traps. As explained above, they are nothing complicated but just a failed high. A very important confirmation most of the time comes from price action.
As the majority of you know, I am a price action trader and try to be as objective as possible in my analysis of the market. I believe that trying to predict price movements won’t lead you to anywhere, whereas reading the market adds a brave new dimension to help you become profitable.
Why Bull Traps Are so Overlooked
As a trader myself, it took me some time to write about those formations. To be precise, exactly  458 articles since I started writing this blog.
That means that even though they are essential, bull traps are probably not the first technical analysis tools that come to mind.
On the other side, if you look at it from a conspiracy point of view, this might be a way for market participants that are profitable to continue being profitable without sharing their “little trading secret” with the retail traders.
Maybe there is only a handful of information out there, because this pattern works like magic…
Not a big fan of conspiracy theories myself, I am not willing to accept this as a valid theory. On the other side, it is worthwhile exploring this beautiful pattern.
So How Do We Trade the Bull Trap
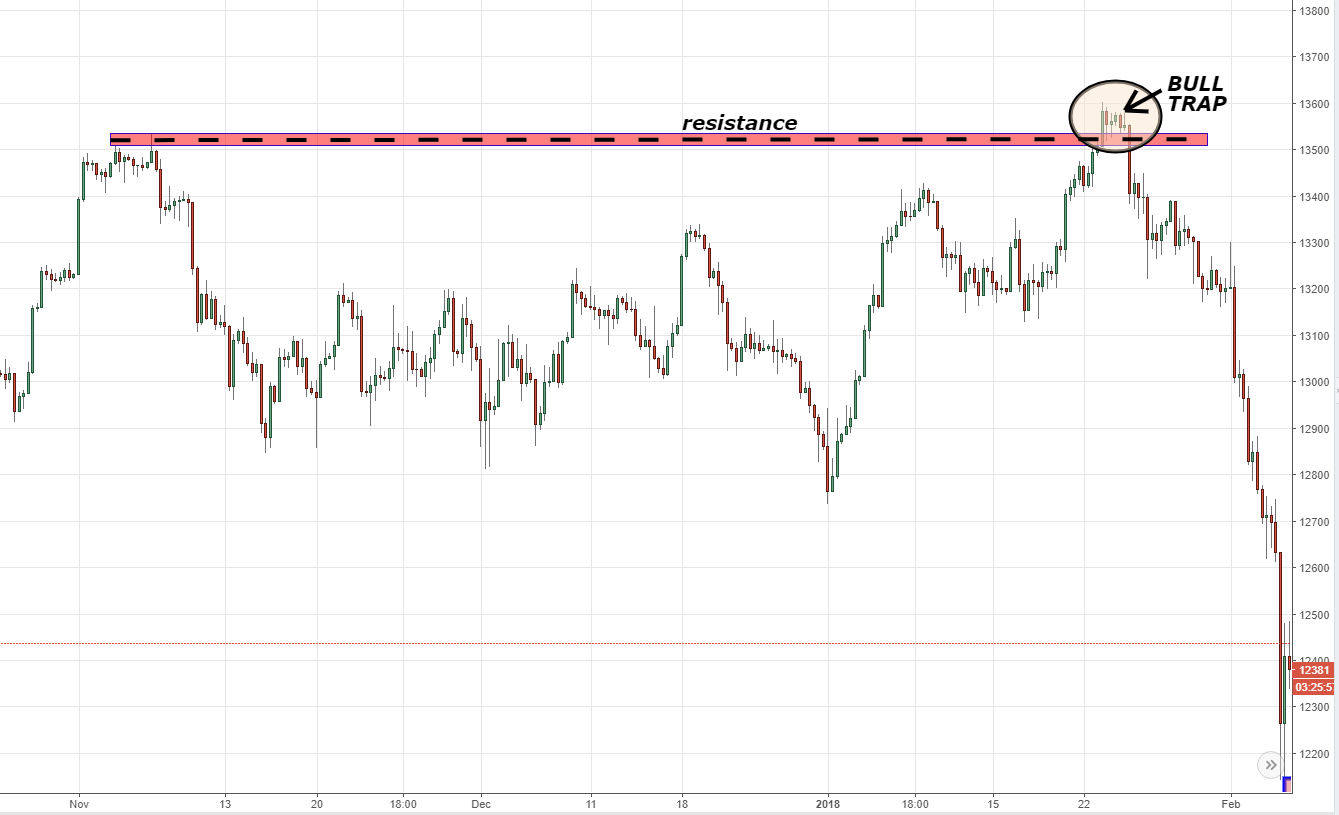
Let’s take another example from a lower timeframe- the 4H timeframe.
This was a trade setup that I analysed in real time HERE. My subscribers know that I have mentioned this trade on a few occasions. Another place is my Twitter post, where I discussed it, as well.
There are two things that are important for a bull trap trader to have in place:
- Strong resistance level formed by a previous high
- Price action confirmation of reversal like a bullish rejection candle, inside bar or a bearish engulfing pattern
Those two criteria were present at the situation above. In fact, if you look at the daily chart, you will see a bearish engulfing pattern. For a more detailed analysis of this trading situation, have a look at my article about DAX.
For the ones amongst you that have taken my professional trading course, you will know how I rely on a confluence of two timeframes. In this case, the 4 hour chart gives a perfect confirmation of this daily setup.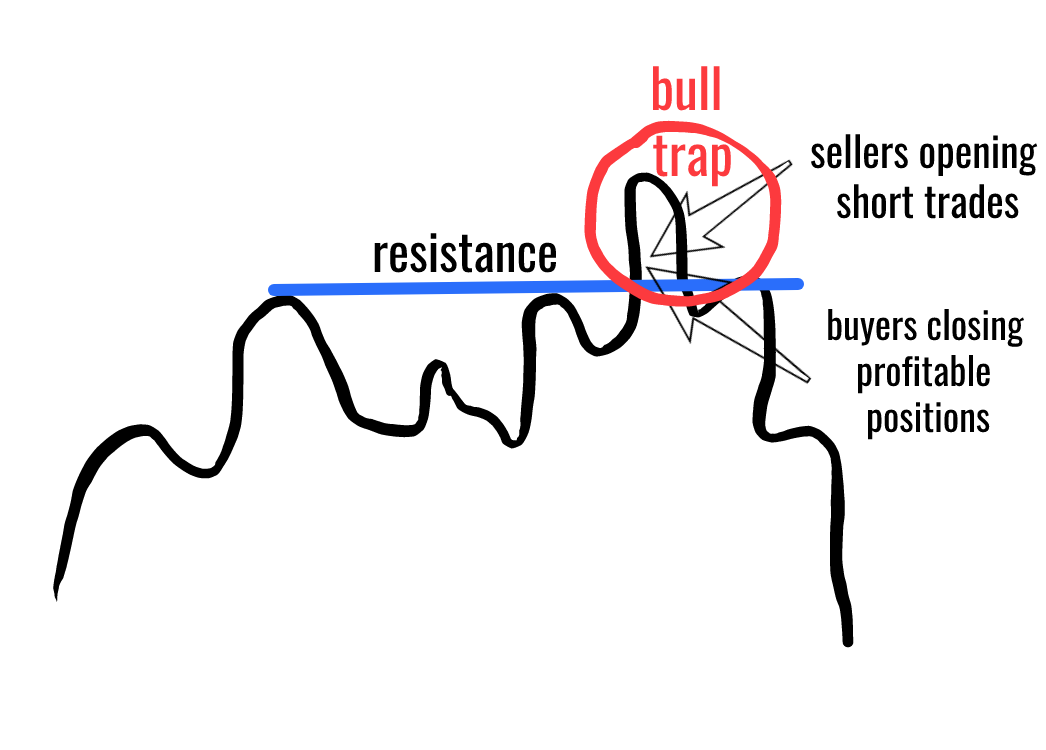
At the top, where the bull trap forms, two things happen:
- A lot of traders that were long the DAX are reaching their targets (a major resistance level) and are exiting positions.
- A lot of traders that were waiting for the price to reach the level of 13,500 are entering in short trades.
The cumulative effect of long traders exiting (closing) their long trades and of traders shorting the DAX at this level is so strong that it:
- Leads to a bull trap
- Pushes the price aggressively lower, thus changing the direction of the trend (at least for the short term)
What is a Bear Trap?
Just like a bull trap, a bear trap is a failed second low. Have a look at the picture below:
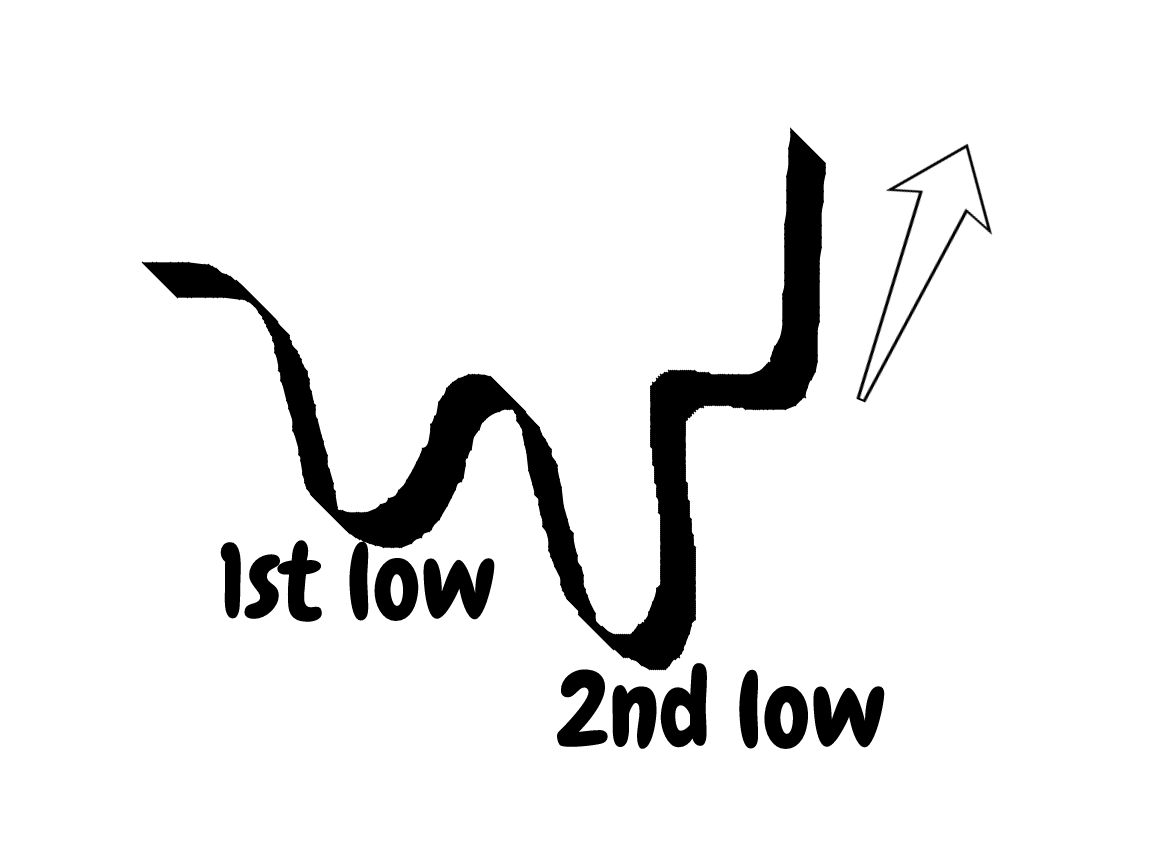
As you can see, the trading situation is the same as with the bull trap, but inverted. Let’s have a look at a real-life example, so you can have a clearer idea:
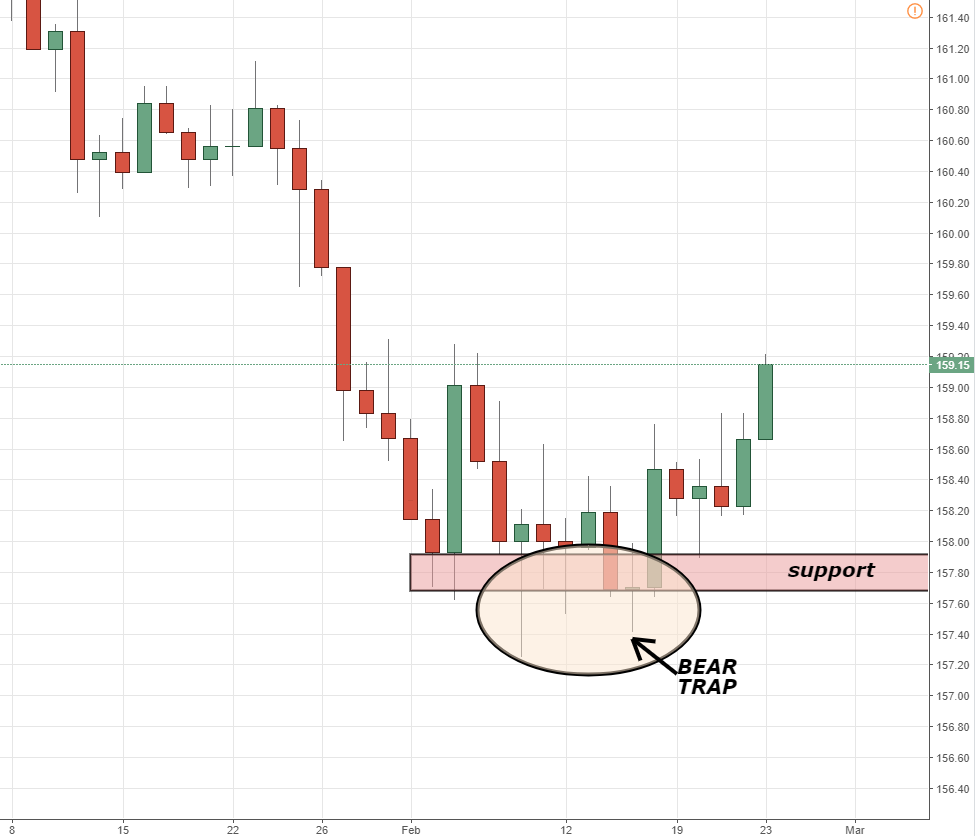
Here is the daily chart of the Bund. As you can see, these setups can form on different instruments and on different timeframes. In this particular example, we have the two criteria for a bear trap, which are the same as for a bull trap:
- Strong support level
- Confirmation from a price action setup, which in this case is a sequence of bearish rejection candles, including a pin bar
From the information given above, you can see that nothing much changes. Bull and bear traps do meet the same requirements and they are as powerful.
In the image below, I will show you the 4 hour chart of the same instrument (the Bund) for the same time period:
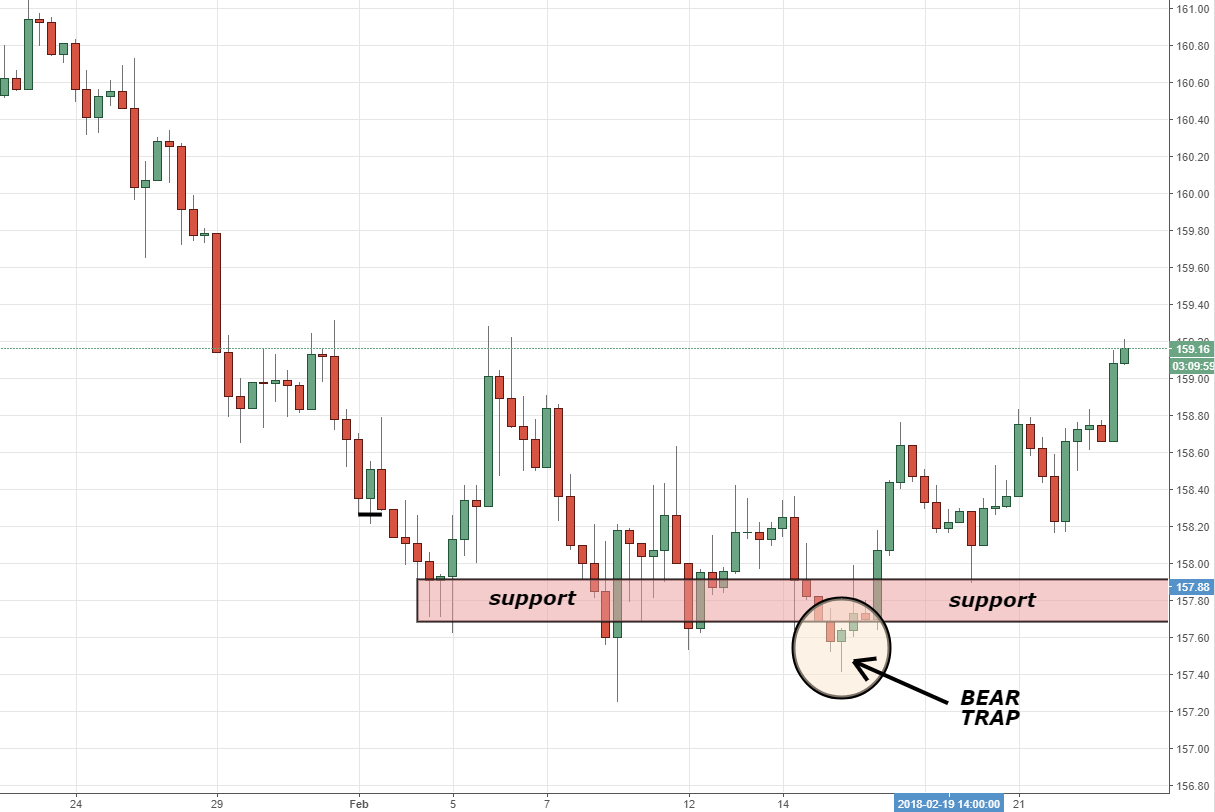
From this lower-time frame chart, you can see the same (or very similar) pattern appearing. I have marked with “bear trap” the place where traders are attempting to enter in a breakout trade, but price action quickly disproves them.
There is a pinbar candlestick, which quickly reverses the direction of the trend.
Instead of Conclusion
Instead of conclusion, I would like to include another last example, so you can see how widespread this bull and bear trap patterns are. Below is given the daily chart of Gold:
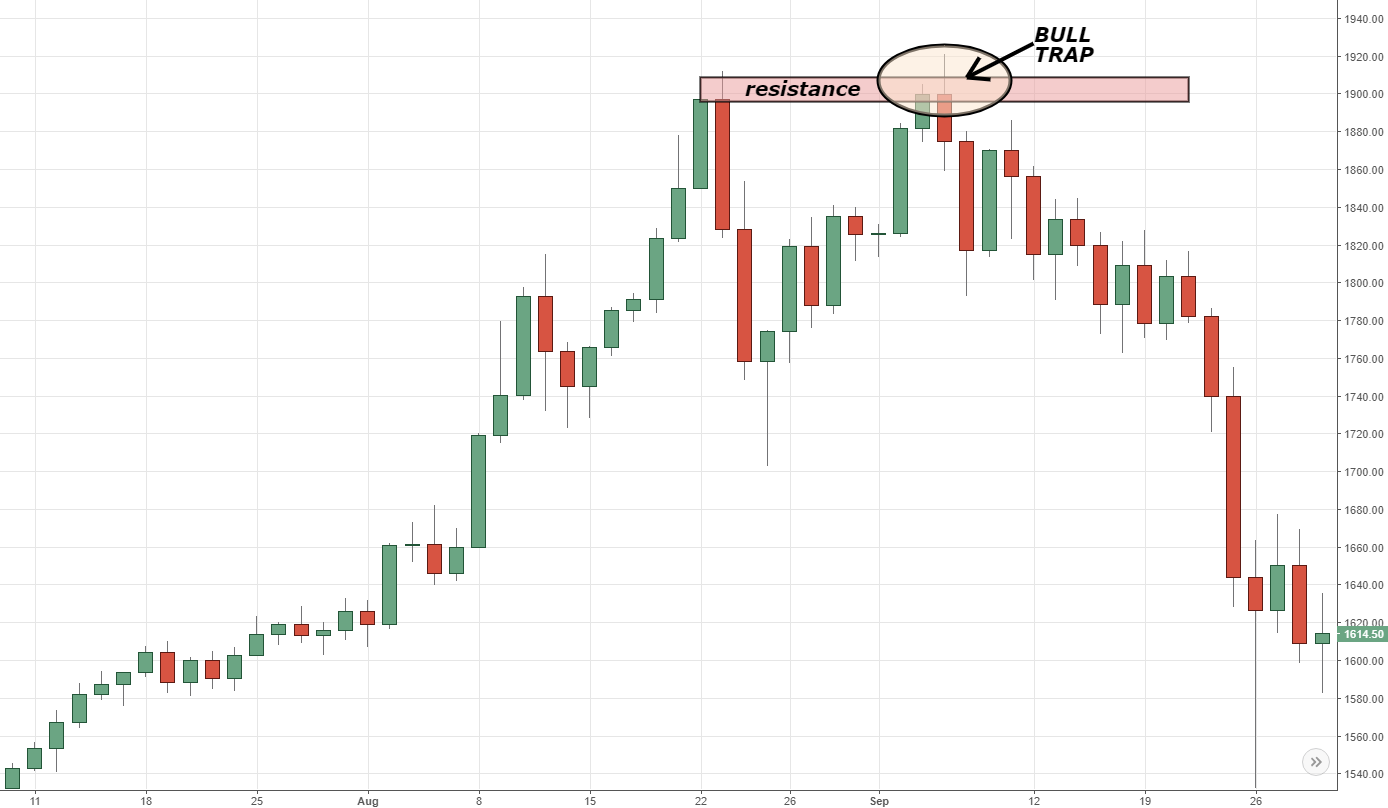
In this example, you can see a small bull trap, which leads to a big sell-off.
One very important thing that has not been mentioned so far is that the distance between the tops for a bull trap does not really matter. In fact, a very small distance (as can be seen in this example) can lead to a very large sell-off.
It is important that you don’t just blindly follow and trade those setups. You should have a methodology and a way to enter in a trade minimising your risk and maximising your profit potential.
I have extensively covered this in my trading strategy, but before you consider taking it, you should familiarise yourself with the following essential topics:
p.s.
By the way, here is a short extract from my professional trading course:
p.p.s.
Thank all of you who voted for me and helped me win FXStreet’s award. You can check out my AWARD from FXSTREET for Best Education HERE
As always, if you have any questions, please do not hesitate to ask me on: admin@colibritrader.com
another great article as always thanks for the lecture
Thanks for the nice words! Trying to keep them coming as often as possible… let me know if there is something you would like to know about that is not on the website already
So, do you mean we should look for lower TF soon after breakouts for any price action reversals
There should be a confluence of timeframes
Great information shared
I certainly have learnt a lot.
thankyou
I am glad to hear that. Please let me know if you have any questions!
Thanks so much for the knowledge on Bull/Bear traps
Let me know if you have any questions. You might also check out the article on supply and demand zones.
Hi CT-
Im noticing this set up in VSCO. I have it in a descending Triangle and i think it’s going to break out at the tip (and after Valentine’s day AND earnings…
But i think it’s currently in a “fake” breakout. And could come down to the 50-ish mark
I bought some Puts for $55 for Jan. 21st.
Any thoughts on it?
I’m looking forward to purchasing both your publications.
(with the profits of this successful trade of course! 🙂
Is the $97 one (Supply and Demand sones) an actual DVD set? with hard copy? or is that just for show?
Also: do you have the $14.97 in Hard Copy? I can always print it out and make my own but i was just curious.. i haven’t bought a book in a while and was wondering if it’s available.
Thanks again!
~Doc
Hi Doc,
I am not sure where you saw a fake breakout. I was only able to pin point a micro supply zone, which also gave a bearish indication on VSCO. Hope that helps. If you have any other questions, please DM me at: admin@colibritrader.com
Thanks