


7 Big Money Strategies to Follow the Smart Money
Big Money (or Smart Money) and What Are They…
Big money is the money that hedge funds or big investors are trading.
Also known as “smart money”, these are the financial transactions that the “well-informed” investors are making.
Every time the price of a particular instrument moves in big ranges, it is considered by other market participants as “big money” moving the markets.

It is an overgeneralisation, but usually big moves are preceded by professional traders sitting on big trades.
There is little evidence to support the stance that “big money” performs better than “non-big money”, but that is the general presumption.
Traders can always get it wrong- even professional traders.
That is where risk management and money management should come into place.
In my opinion, the best traders are not the traders that manage the biggest funds in the world.
The best traders are the ones that know how to manage (and do it) risk right.
Contents in this article
- Strategy Nr. 1 – Support and Resistance Levels and Big Money
- Strategy Nr. 2 – Round Numbers (Psychological Levels)
- Strategy Nr. 3 – 1-2-3 Reversal Top/Bottom
- Strategy Nr. 4 – Volume and Big Money
- Strategy Nr. 5 – Changes to Insider and Institutional Ownership
- Strategy Nr. 6 – Commitment of Traders Report (COT)
- Strategy Nr. 7 – Berkshire Hathaway and Smart Money
- Conclusion
Support and Resistance Levels and Big Money
>>DOWNLOAD FREE EBOOK HERE<<
Where is the majority of big money concentrated?
Is there a rule that helps professionals to trade better and give them more confidence.
Although trading is a unique discipline and generalisations are better to be avoided, there are certain commonalities when it comes to trading.

Round Numbers (Psychological Levels)
Another important factor when you want to follow smart money is to look for the round numbers.

Let’s say the price is gravitating around the psychological barrier of 1000. It will have a more powerful effect on price than if it was located at around 970.
Round numbers play a crucial role in orders distribution.
If you were to place an order over the phone (as they used to do back in the day), will you say “buy 10 shares at 973.5” or you will say “buy 10 shares at 1000”?
It is human psychology and in trading it plays a huge role.
As the illustration above shows you, there are usually clusters of orders around the round numbers.
There are a lot of stop-losses and limit orders, too.
But they are just as good as market orders and they are just as valid for moving the price as are the market orders.
Do not underestimate the power of round numbers!
Check out this video that I have created that walks you through the article:)
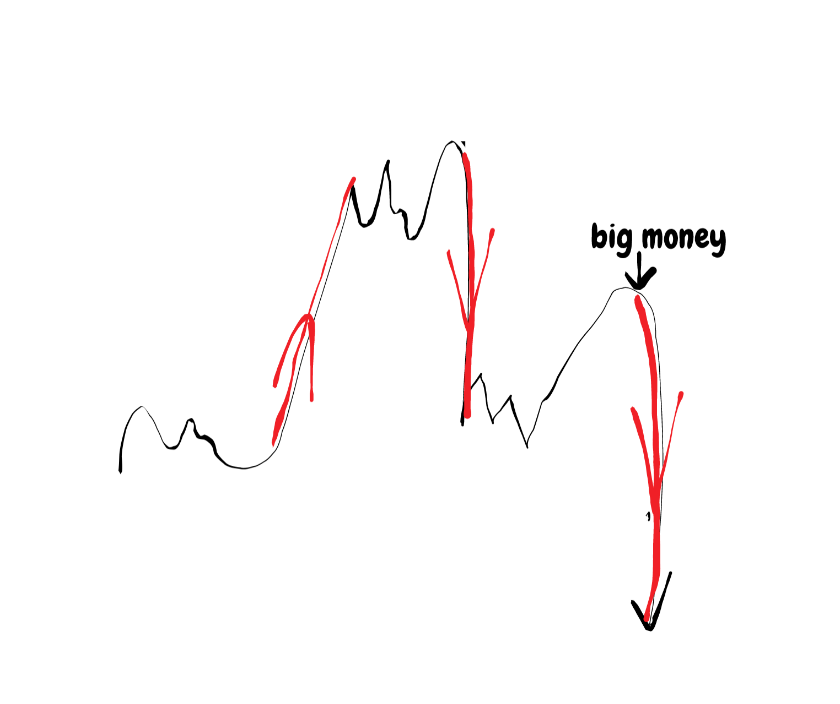
1-2-3 Reversal Top/Bottom
Big money can also be found around the tops and bottoms in the shape of a 1-2-3 reversal pattern.

This is an illustration for a reversal pattern. As you can see, the image on the left resembles a bear trap. The image to the right- bull trap.
These are also known as “fakeys” or fake breakouts- the favourite place of the big money.
These are also areas that could be detected with the help of a supply and demand zone strategy.
Level 1 represents a fresh low.
At level 2, price is already making a new lower low (this is where the majority of market participants gets stopped out).
Around level 3 we have a new high. This is a crucial place and possibly a good entry point for the “big money” traders.
Volume and Big Money
Possibly the best indicator for stock market traders.
Volume is a great indicator of smart money positioning.
I remember the day when I was starting out in stocks trading and found that this is actually an awesome indicator.
It took me a while to master, but it is definitely worth it.
Volume shows you when there is an upsurge in interest and when there are more buyers than sellers just before a new uptrend is about to start.
Let’s have a look at the daily chart of HP:

Let’s have a look at the chart of Morgan Stanley now:

As you can see in the screenshots above, with the increase of volume comes an increase in the interest.
Let me draw the change of volume and smart money in a a more simple way (excuse my drawing skills).

Although an oversimplification, this is the way increase in sellers/buyers affects prices.
Decrease in volume leads to either range trading or decrease in prices.
Although not a rule itself, bigger volume is enough to attract more market participants.
Once again, smart money leads to the initial spike in volumes, which consequently leads to other market participants to follow.
Let me use another example from the stock market where you can see the an increase in sellers pushing the price lower.

Here an increase in short sellers leads to a sharp decrease in prices.
You can see smart money in action again 🙂
Changes to Insider and Institutional Ownership
If you are a long-term investor it pays back to know how to read insider and institutional ownership reports.
They reveal what percentage of the company’s shares are owned by company’s owners and most important investors.
This is another way to reveal where big money is “hiding”.
There are whole investment theories on the subject, which are outside the scope of this article.
But the simple logic behind this trading approach of detecting smart money is:
A) Gather as much info as possible from the reports
B) Analyse the reports and see if owners own more or less compared to last year
C) Decide whether to buy, sell or do nothing

Commitment of Traders Report (COT)
The COT report is a weekly report that is enumerating the positions held by in different futures markets.
It is used to read where the big money are located. The report is released every Friday at 15:30 Eastern Time.
The Commitment of Traders Report was first published in 1962 and can be traced back to 1924.
The COT report measures the net short versus long positions in a certain market by its speculators.
Usually FX traders use the futures data to read where the big money is.
Yes, that is right…
Spot FX traders use Futures because this is probably the closest indication of the net positioning of FX traders.
You can obtain the COT report from here:
http://www.cftc.gov/marketreports/commitmentsoftraders/index.htm
The players in this report that form up the data are:
A) Commercial traders (big money)
B) Non-commercial traders (big money)
C) Retail traders (small speculators)

When large speculators are buying or selling they can make the price reverse or spike dramatically.
That is why knowing how to read the COT report is important.
As with everything else, being good at reading it is not a guarantee that you will make money in the long-term.
Traders cannot solely rely on reading where the smart money is located to have positive returns over the long-term.
Berkshire Hathaway and Smart Money
Alternative approach to finding “smart money” is by following what other smart investors are doing.
A very famous approach is to buy a basket of stocks that Warren Buffet (the owner of Berkshire Hathaway) owns.
Instead of buying shares separately, some investors choose to buy a share of his publicly traded fund.
No matter which approach you choose, keep an open eye for changes of the overall market direction.
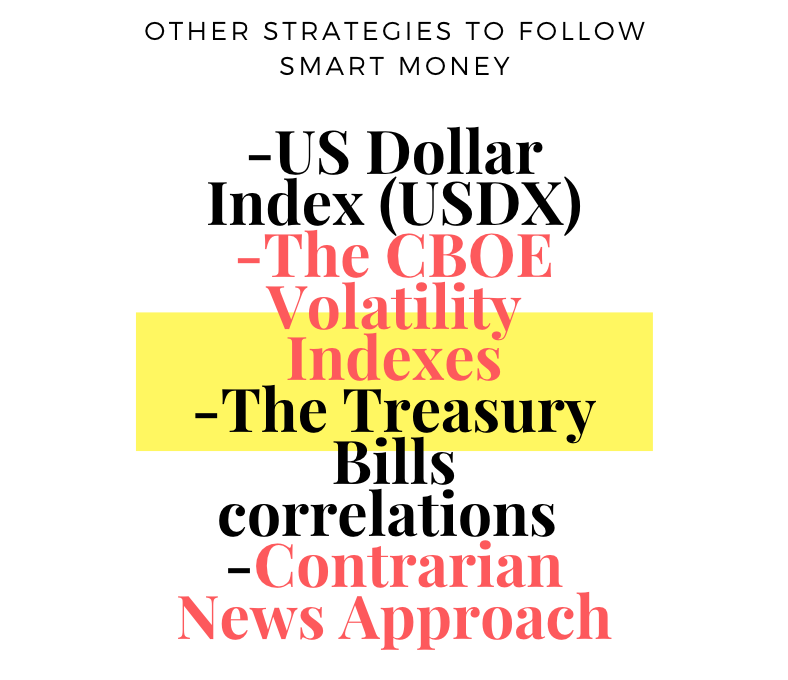
Other Strategies to Follow Smart Money
There are a few other strategies to follow “smart investors” and amongst them are:
- US Dollar Index (USDX)
- The CBOE Volatility Indexes
- The Treasury Bills correlations
- Contrarian News Approach
Even though there are thousands of articles on these topics, the issues with these strategies are the same.
They do require time to master.
Traders also need to be careful how they are implementing them since they do have their flaws, as any other strategy.
Conclusion
Following other traders with more knowledge or deeper pockets has always been a way to trade but apparently not always a winning way.
As it was laid out in this article, following the smart money in trading has many different angles.
You can employ a number of different strategies or concentrate on just one clear way to profit from this strategy.
No matter which strategy you choose to follow (if any), they do hide their flaws and they are not a sure way to make money.
After all, the best strategy to follow is the one that makes money in the long-term.
If that is one of the above-mentioned strategies, just follow the rules and don’t look elsewhere.
Happy Trading,
Colibri Trader
p.s.
Have you checked my article on Trend Following? And you can check Price Action Trading PDF
you are just awesome person.
thanks for everything and hoping more yet to come
Thanks for the nice words! Hope everything I do is helping you! I know how hard it is when you are just starting in trading
when ever i enter with huge quantities I can’t stay stable and in frightening mode i exited few seconds in loss, if i stay just 3-4 minutes in same trade then I will mint platinum. I swear. How to control mind?
I want smart money direct me please
Can you be more concrete please? How may I help?