


The Advanced Supply and Demand Zones Trading Guide: Untold Truths
The Advanced Supply and Demand Zones Trading Guide: Untold Truths
Supply and demand zones offer one of the best ways to trade the market- clear and objective.
I believe you have already read the first part of trading with supply and demand zones, but if you haven’t yet, please check out the previous part of this supply and demand zones series.
In this article, I will elaborate on more advanced methods of using the supply and demand zones and what works for me and what doesn’t.
Here it is, the second part of supply and demand zones trading.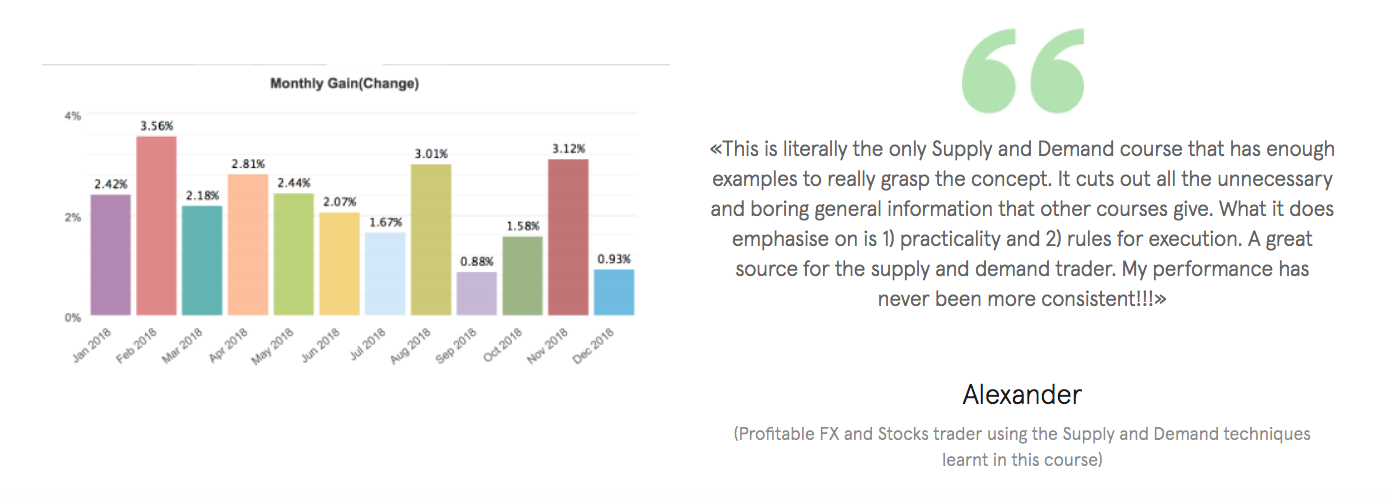
What are Supply and Demand Zones- Brief Reminder
Let’s remind ourselves what are supply and demand zones.
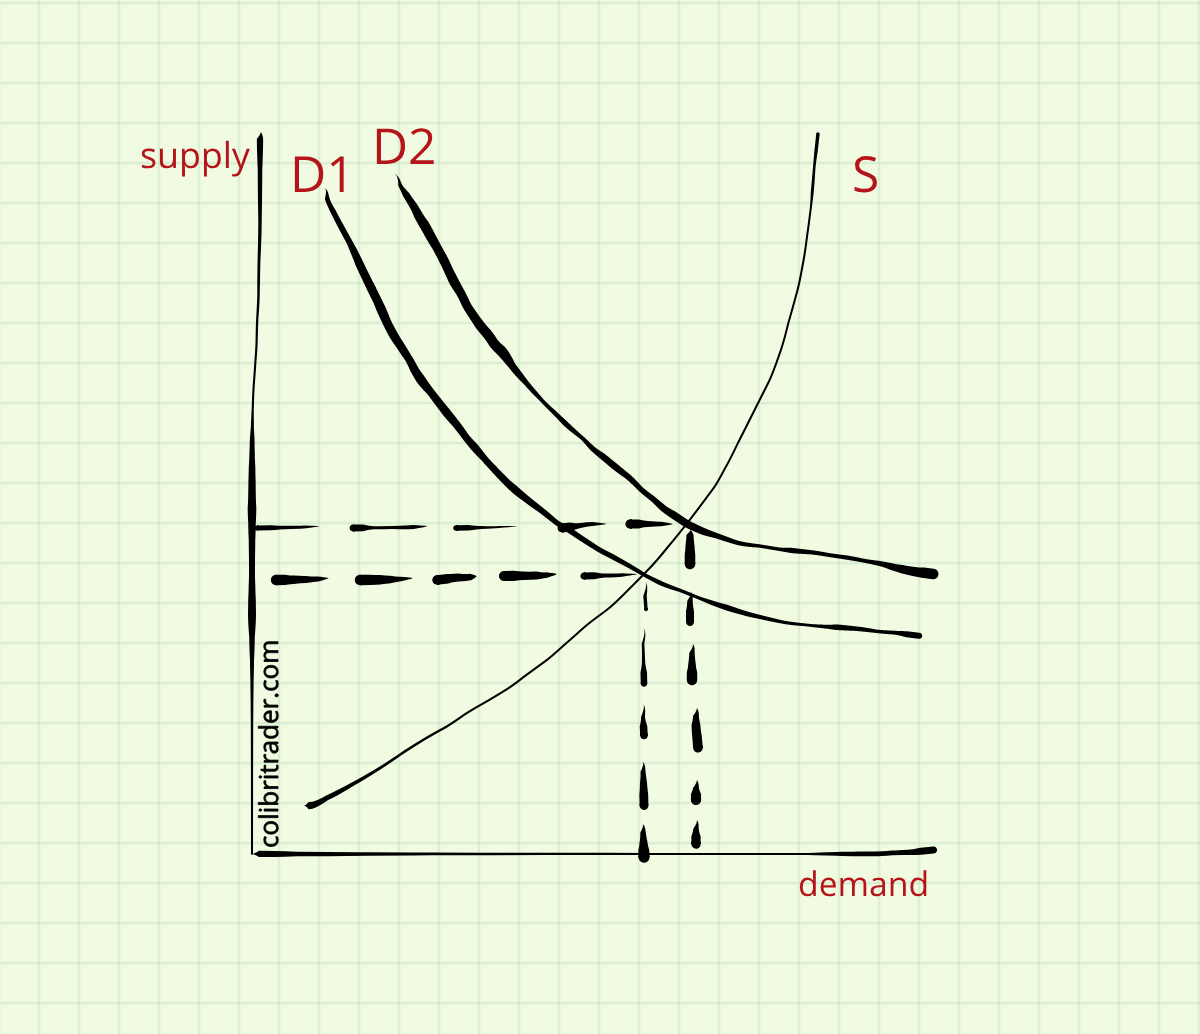
First, let’s have a look at the chart below:
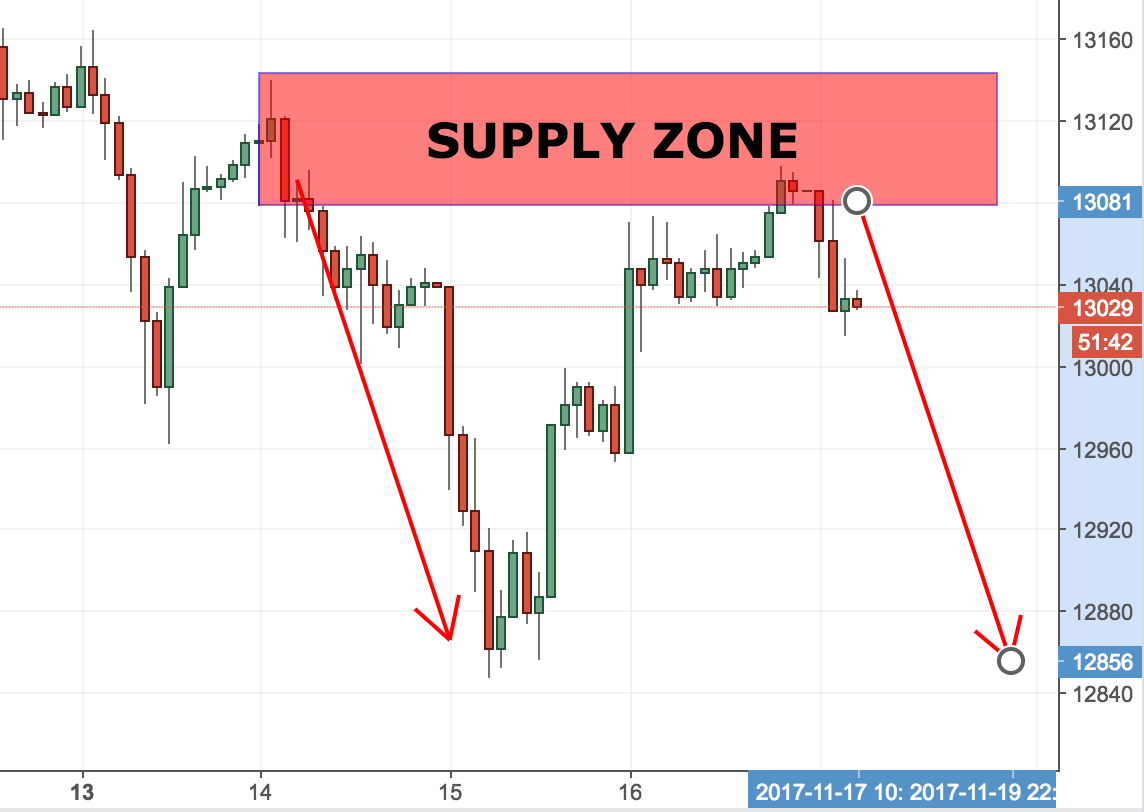
Supply zone is an active resistance zone, which acts as a magnet to sellers.
A zone is by definition a broader area, which attracts bears from all kinds:)
On the contrary, a demand zone is a broad area of support. Let’s take a look at the chart below:
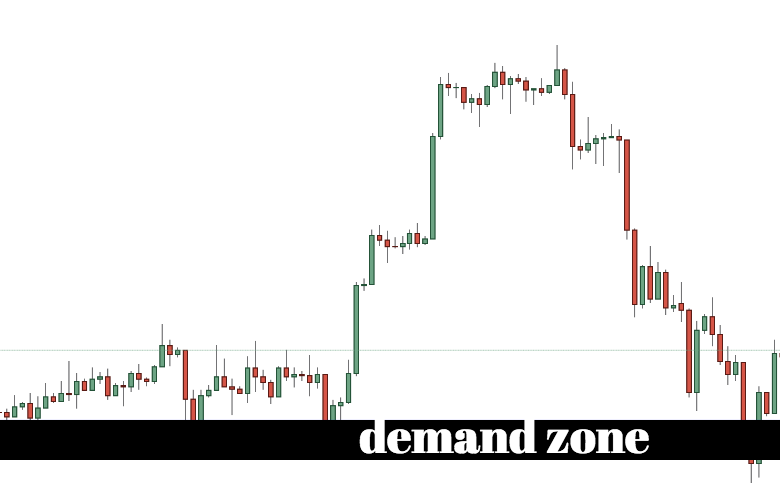
Although repetitive, those are fundamental basics that you should start with when looking at supply and demand zones.
There are ways to detect supply and demand zones and they were described in the previous article HERE.
I strongly encourage you to read through it if you have not done so, yet!
Why Supply and Demand Zones Are Better Indicator Than Simple Levels
In order to answer this question, we should first start off with what is the difference between zones and levels.
Let’s have a look at the example below showing a level:
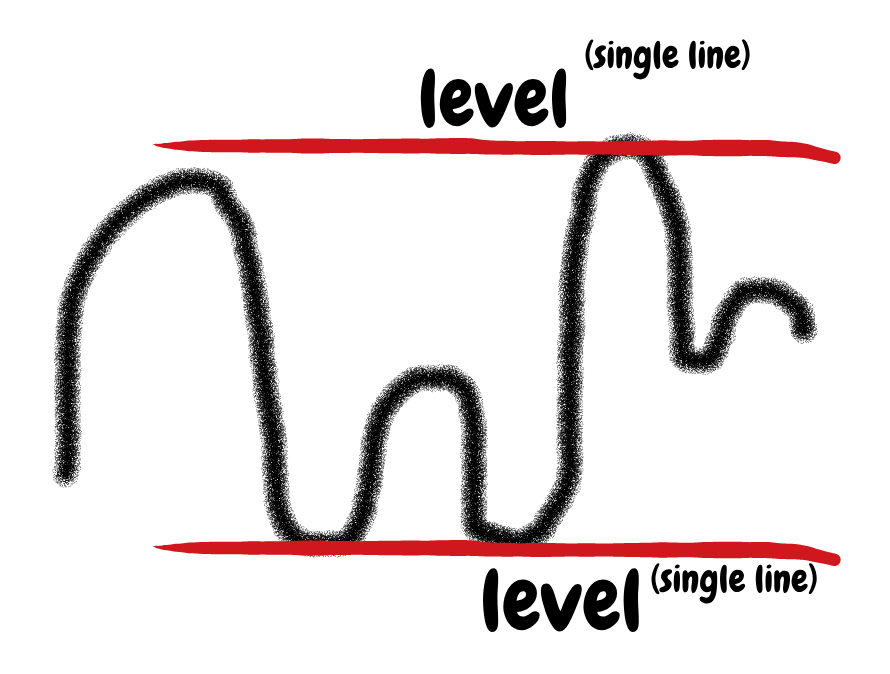
Let’s have a look at a supply and demand zone:
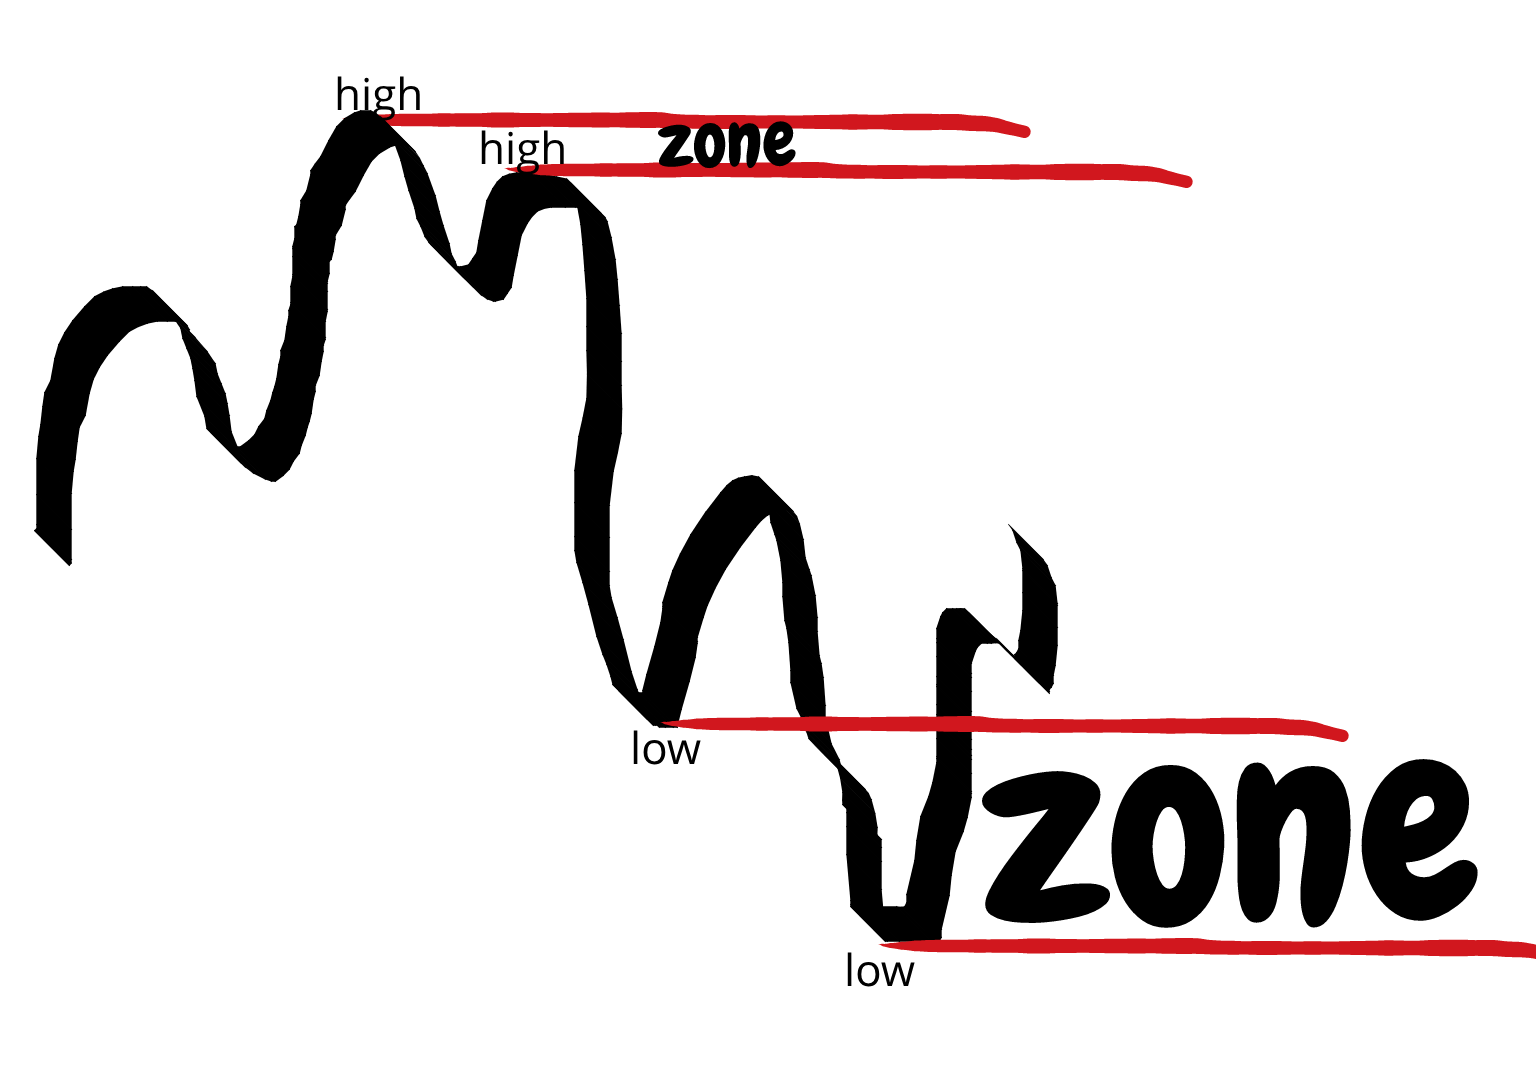
As you can see from the sketch above, a zone is the distance between two neighbouring highs or lows.
It is a wider region by definition that has more strength than just a single level.
That makes supply and demand zones a better indicator of any future price movements than a price level.
Bear Traps with Supply Zones
First of all, what is a bear trap?
Bear traps are nothing more or less but a failed second low.
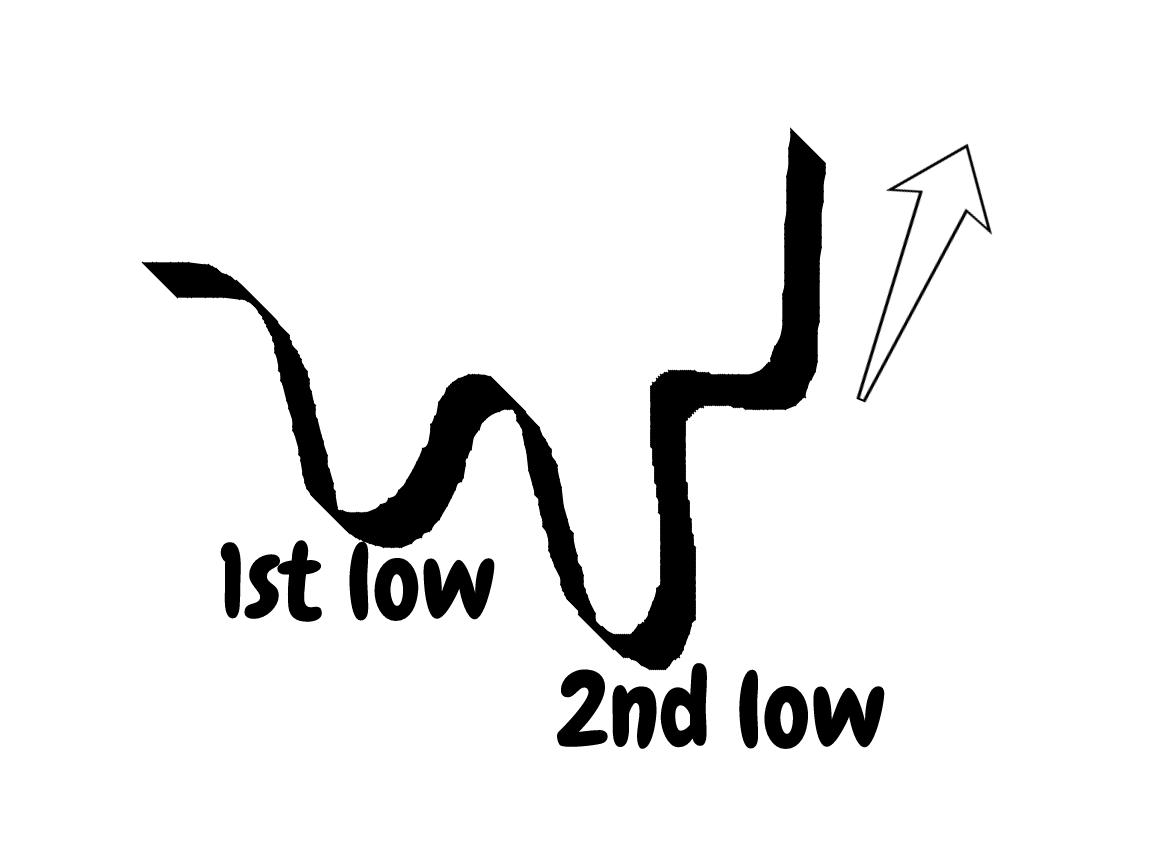
As the image above shows, after a second low, the price does not go any further, but starts a sharp climb upwards.
I have a very detailed article on bull and bear traps, which you can check out HERE.
In the context of supply and demand, a bear trap is a very useful pattern.
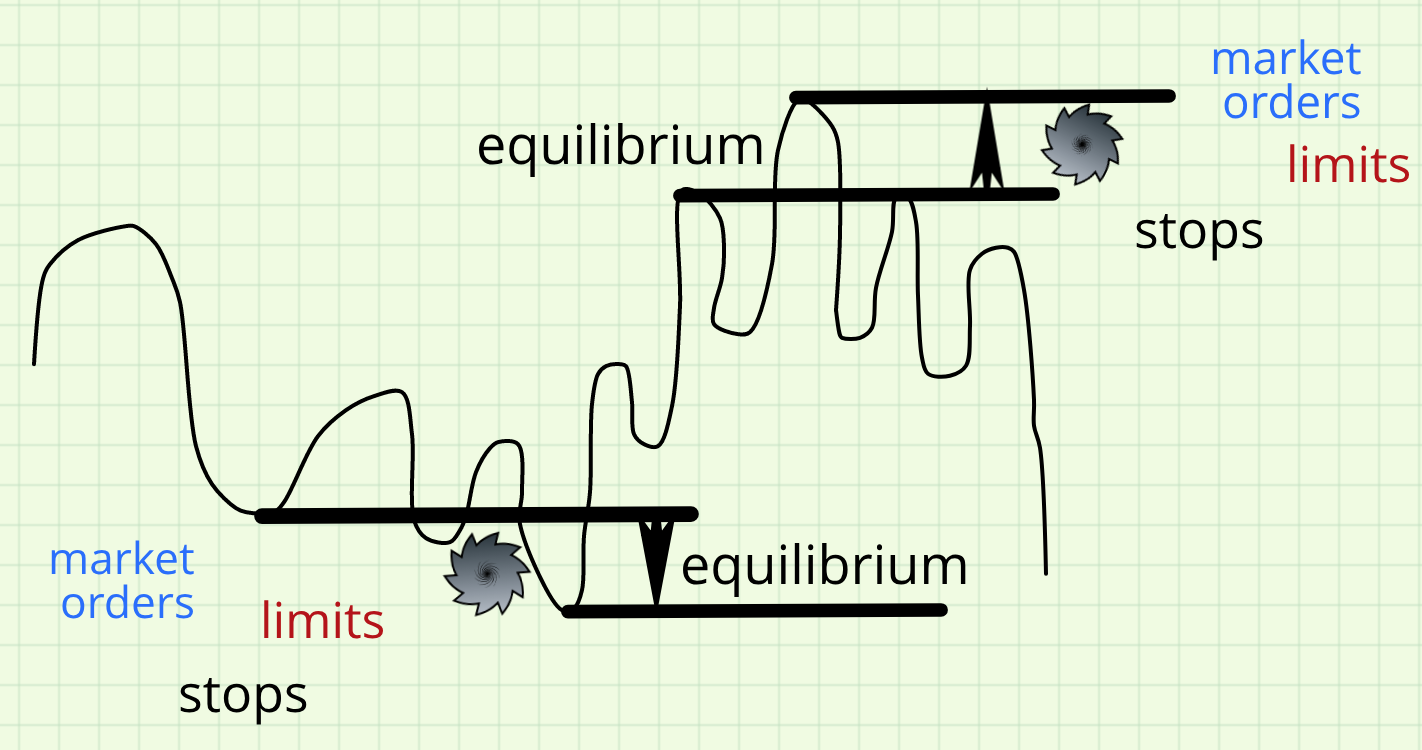
What I am usually looking for when using supply and demand in my trading is a bear trap below a demand zone.
This is probably one of the strongest patterns in trading that combines price action and supply and demand zones.
It is an area where a lot of stops and limits are hit and that is what makes it so powerful. It is also an area of an equilibrium that attracts more interest than any other area in trading.
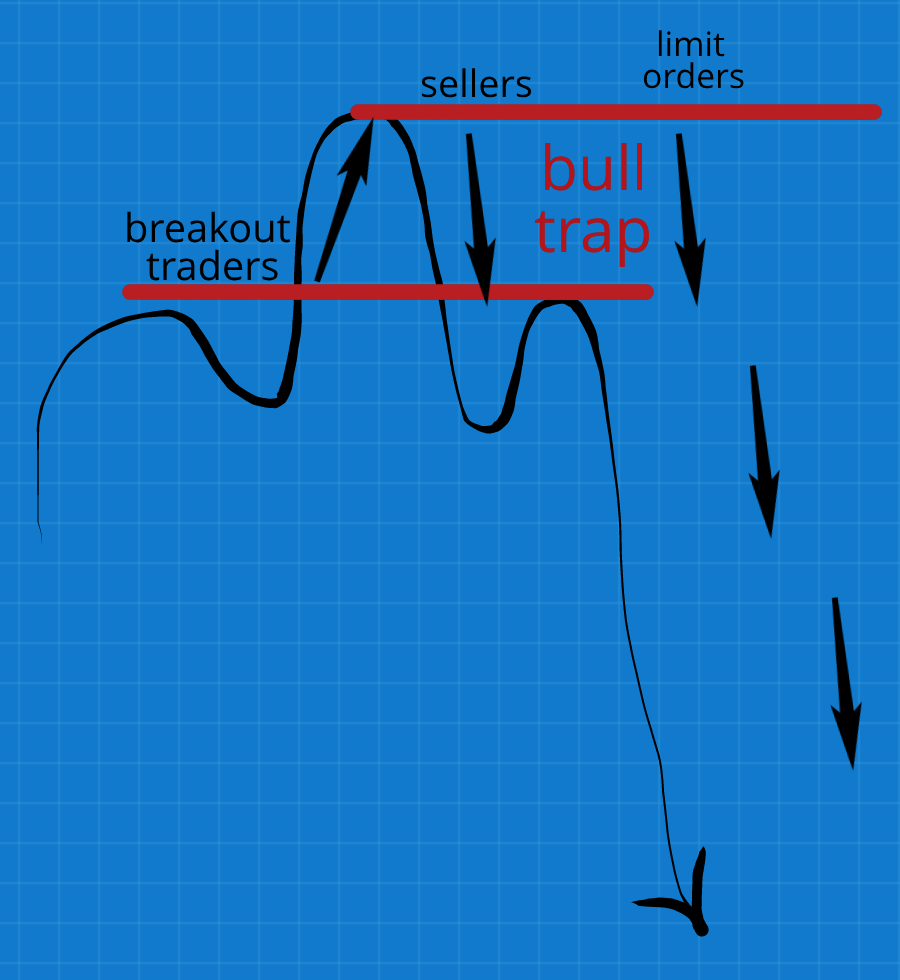
Bull Trap with Demand Zones
The opposite of a bear trap is a bull trap.
It is the moment when a lot of breakout traders are piling up long positions betting that the price will continue its extent.
Unfortunately, their expectations are not met.
Alas- quite the contrary!
In fact, price reverses action and takes a lot of those traders’ stops out.
On the other side, there are the supply and demand traders sitting on those same levels and counter-meeting the long orders with short orders.
This war-of-tug battle is combined a lot of limit orders being hit, which in its turn accelerates the selling pressure and leads to a sharp move down.
Indicators with Supply and Demand Zones
I am not the type of trader who uses profusely indicators.
Even quite the contrary! My students know exactly what I use and most of the time, it is the chart itself.
Juggling between a few timeframes and using price action has proven to be the best tactic when it comes to using supply and demand zones.
On the other side, there are traders that are using indicators in combination with supply and demand zones.
Traders are looking for a confluence between indicators and supply and demand zones.
I cannot blame them for that, but indicators have proven almost useless for me to use in conjunction with supply and demand zones.
One of the only exceptions is probably the RSI indicator.
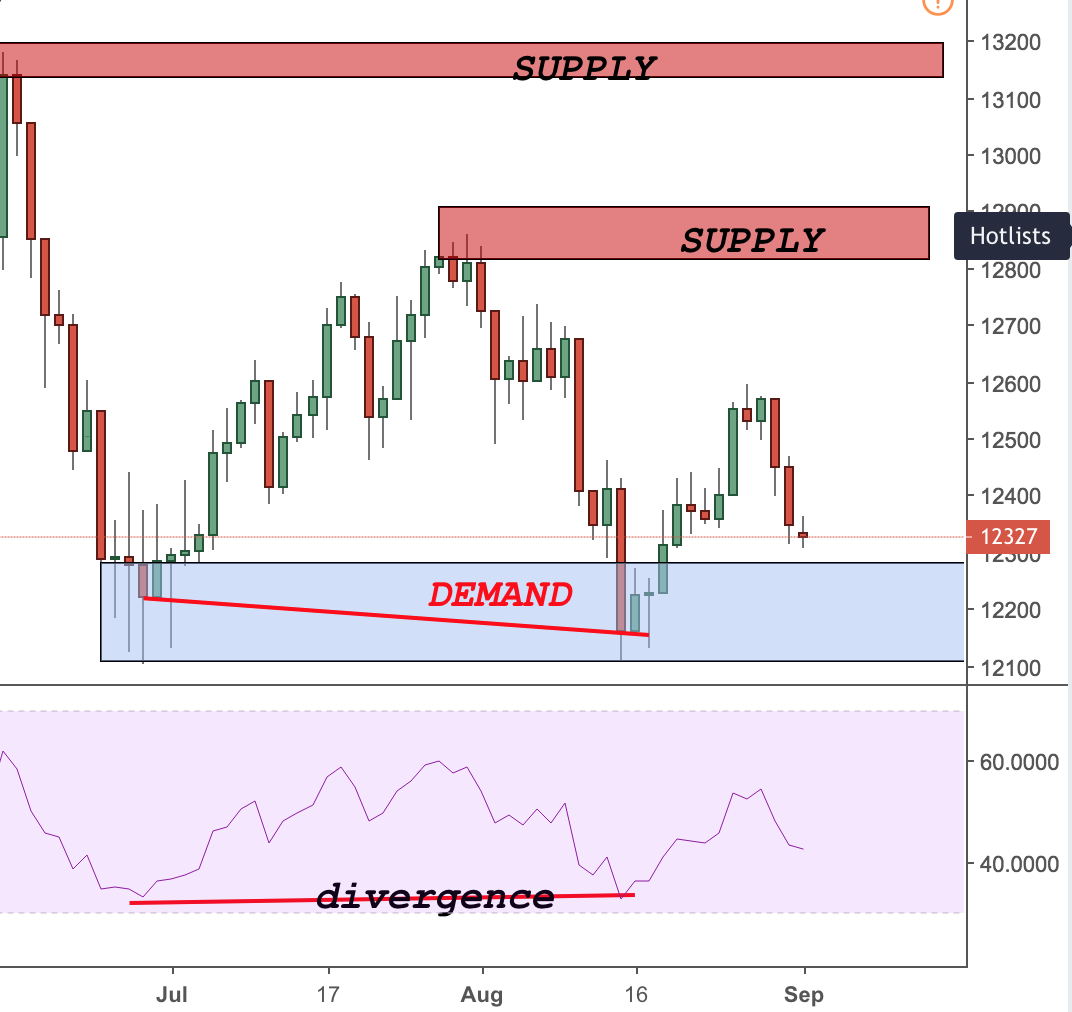
A possible way to trade supply and demand zones by using indicators is by finding divergences between an indicator and the price.
If that coincides with a supply or demand zone, it gives you an even better indication of which way the price will go.
I personally prefer not to mix supply and demand zones and indicators.
The cleaner the chart, the easier to read the signal!
Price Action and Why It Is the Best Way To Trade Supply And Demand Zones
Price action is the way I trade the markets. As you might already know, I do combine it with a few other tools, but certainly try to keep it clean.
Price action trading fits perfectly well supply and demand trading.
There is no better confirmation for a supply or demand zone that a price action pattern.
A) Supply Zone Example with Price Action
Let’s have a look at the following example: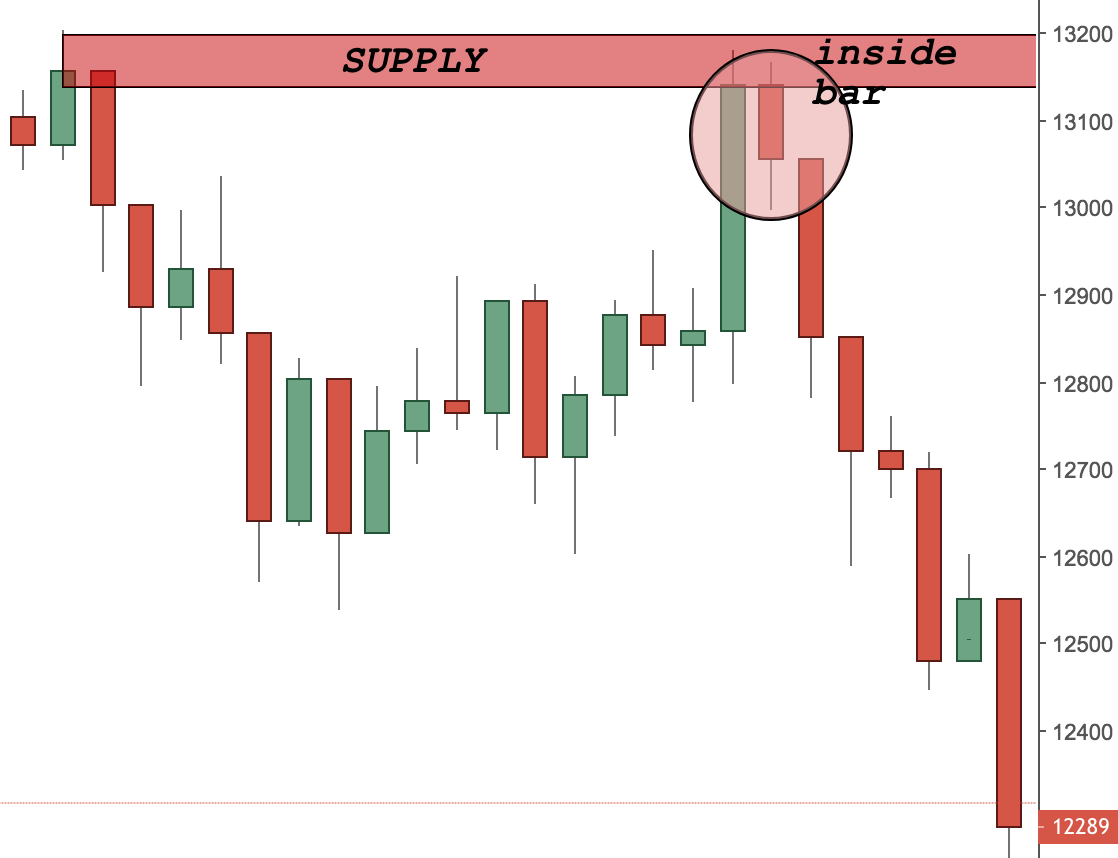
That is a great example of a combination of price action trading and supply and demand zones.
There is an inside bar that formed inside the supply area.
As you can see, it influenced the price and led to a large sell-off in DAX.
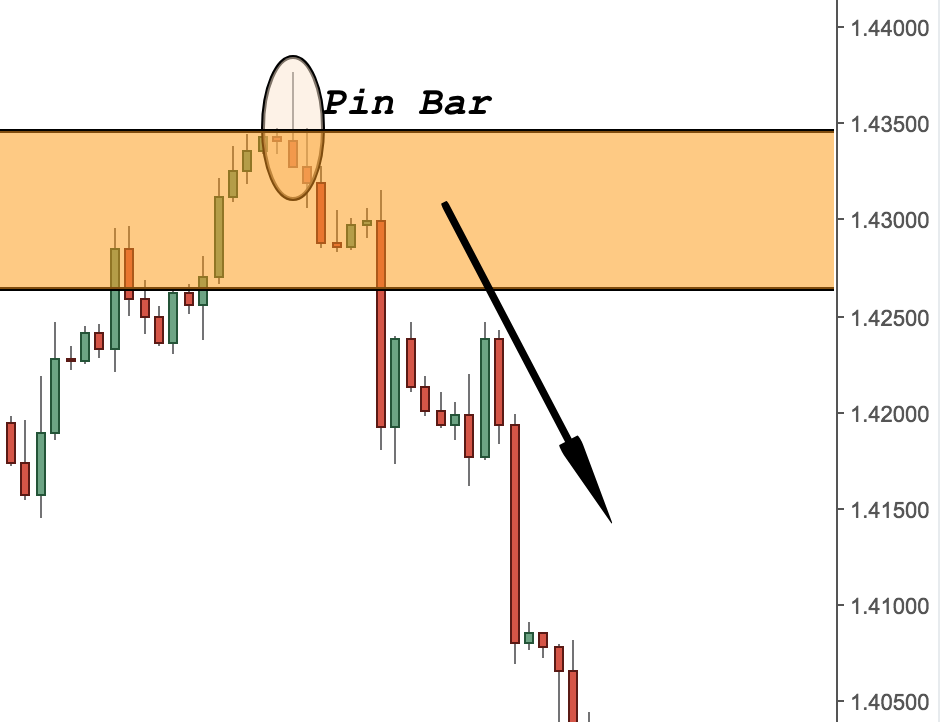
B) Demand Zone Example with Price Action
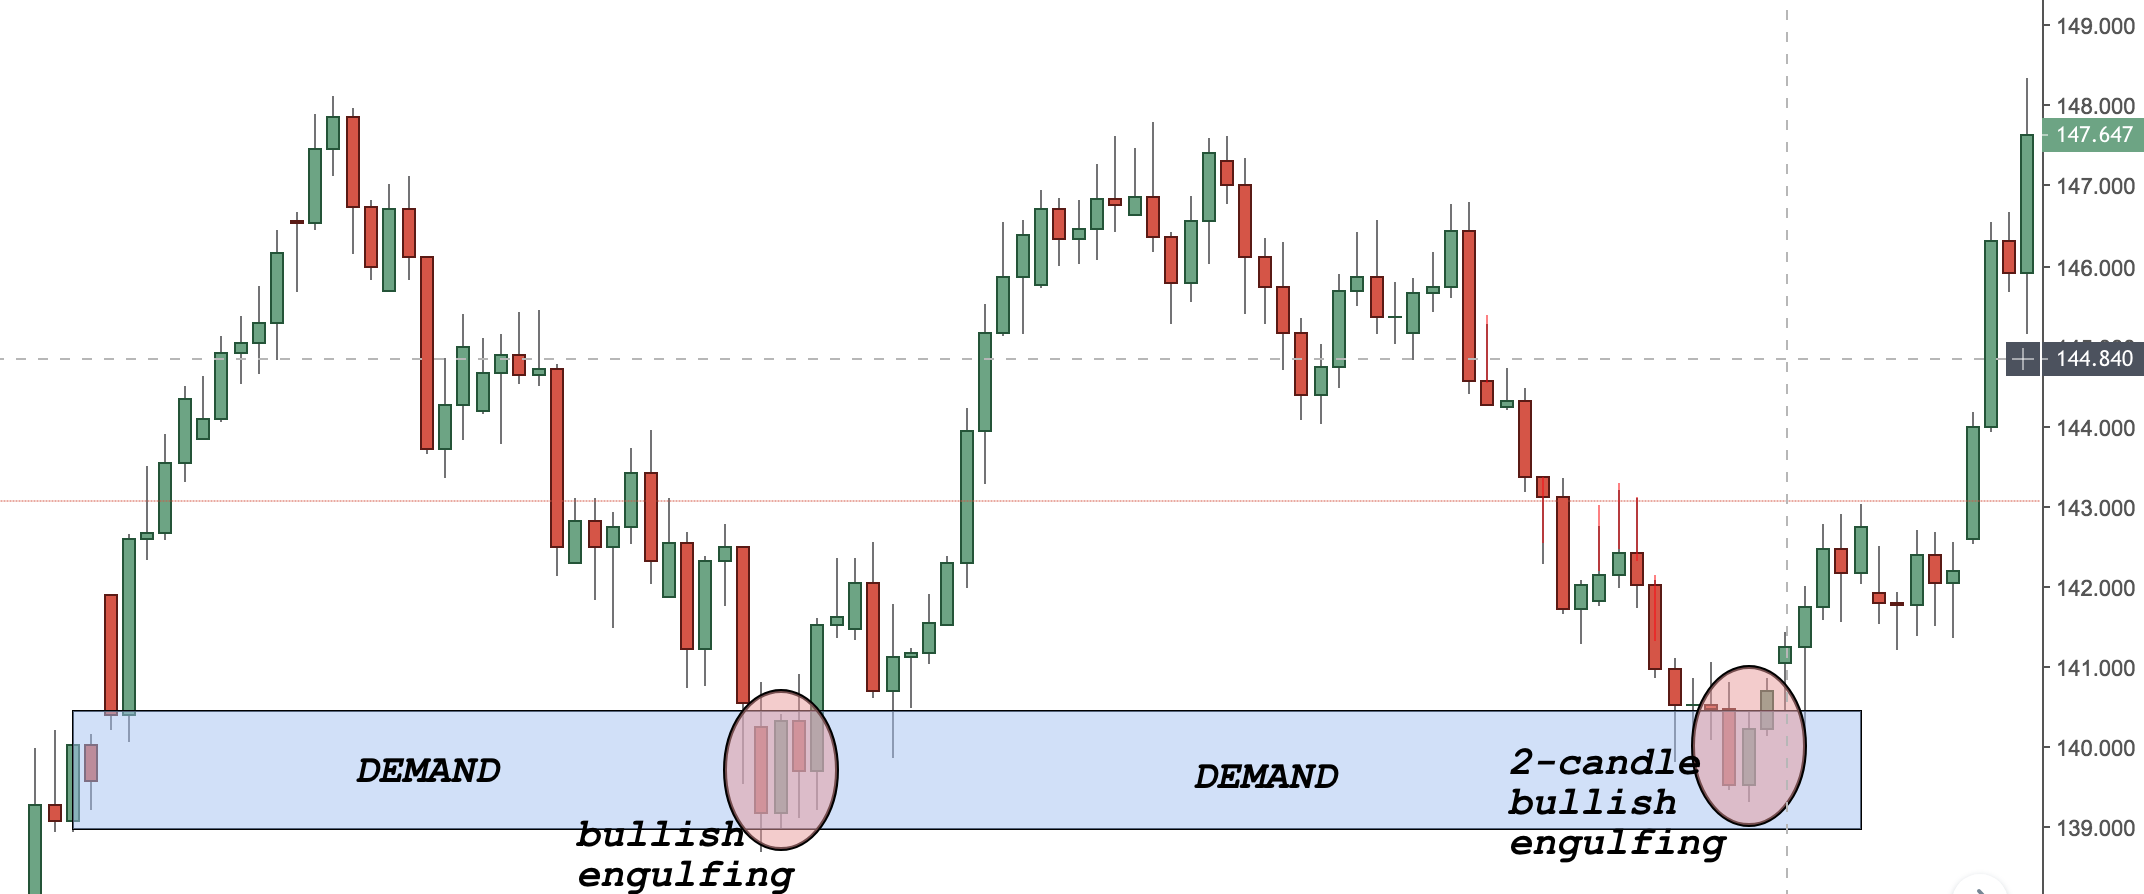
As with supply zones, trading price action with demand zones is a great way to enter into a high-probability trade.
Here is an example of a demand zone trade with price action.
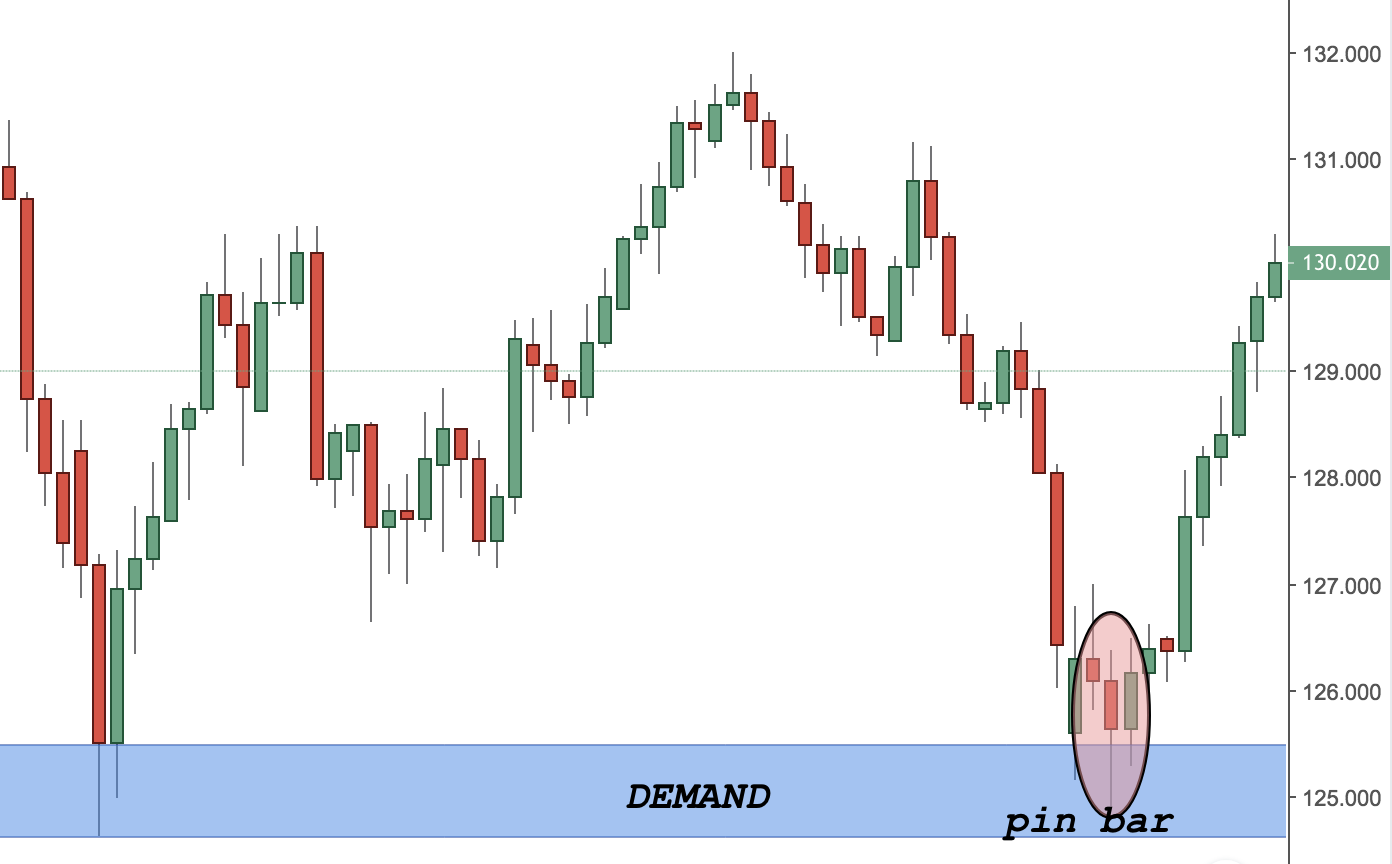
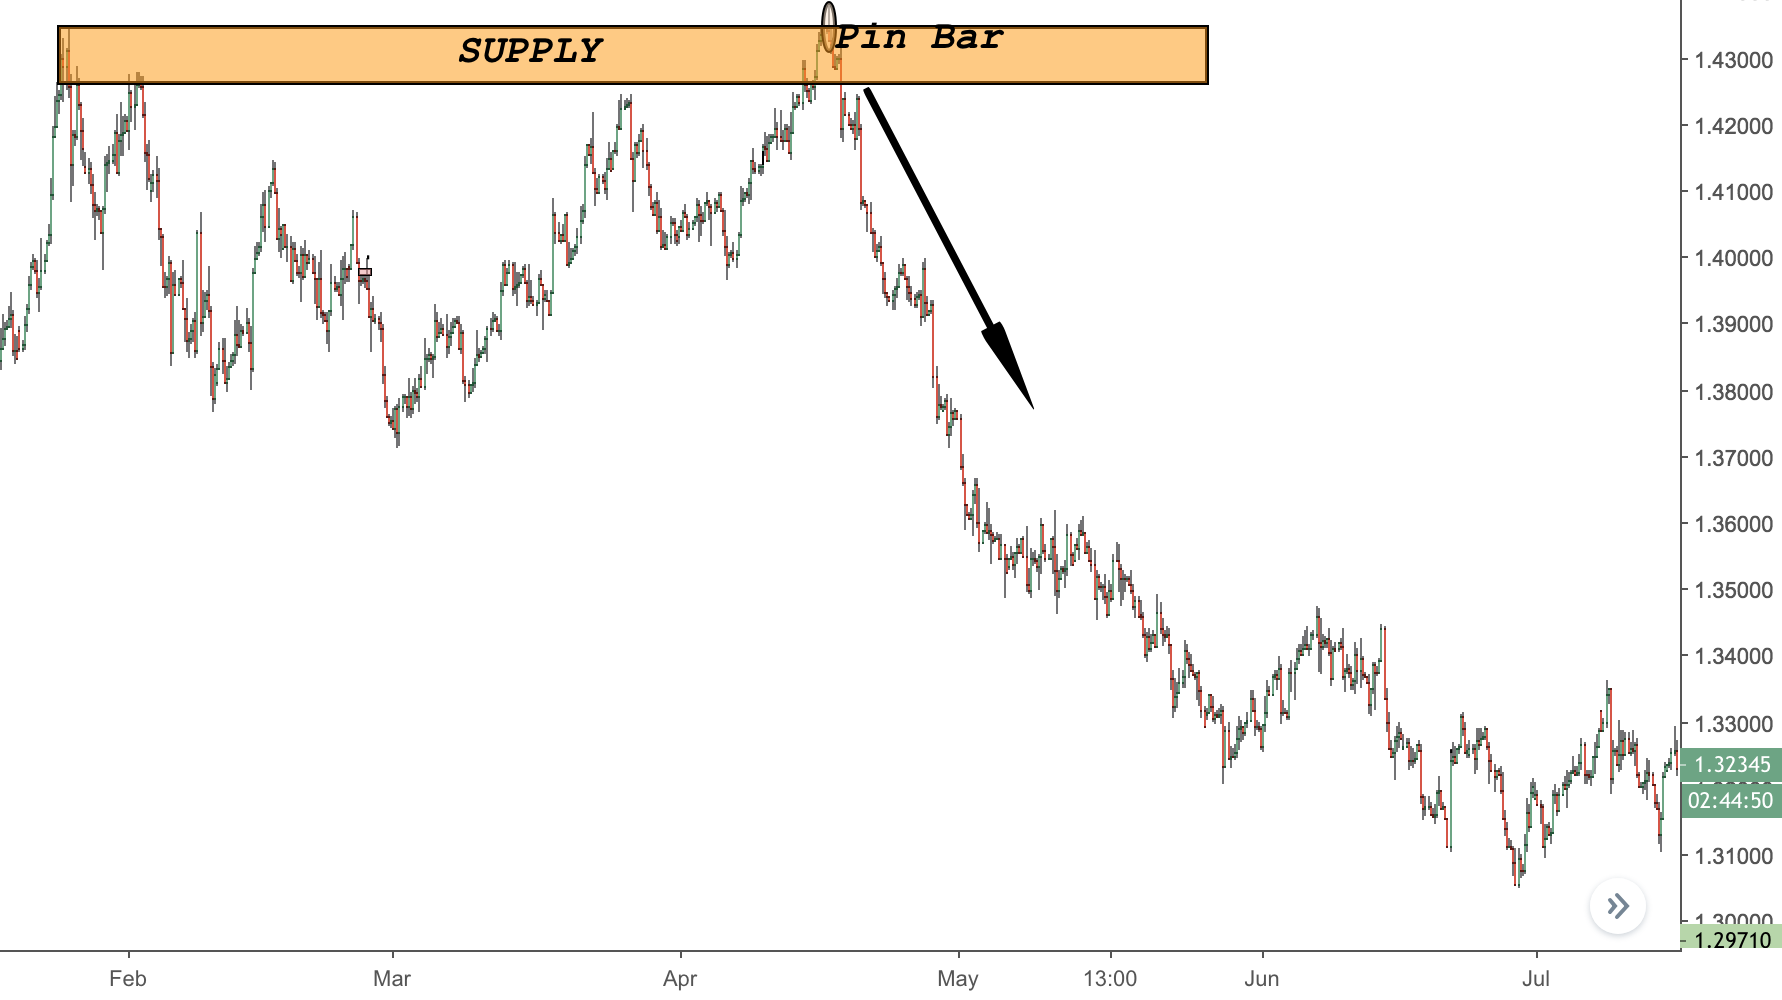
As you can see from the figure above, this demand zone around 125.00 is a great example of a support.
Together with the pin bar, it forms a great reversal point.
From my experience in trading, there is nothing more powerful than a combination between price action trading and supply and demand (or areas of support and resistance) zones.
The example above is taken from the EURJPY daily chart from 2018.
Money Management and Supply and Demand Zones
Money management and risk management are key aspects of trading with supply and demand zones.
There is nothing more important than having the right money management skills.
For a full article on money management, you can visit this page, where I talk about it extensively.
For the sake of this article, I would just share with you that no matter how appealing a trade looks like, you should always abide to your trading rules.
No exceptions!
No second chances!
Just the right amount of risk per trade.
I have detailed a whole system of how to properly manage your risk. It is part of my Supply and Demand Course.
I usually like to minimise risk while increasing the return possibility and the system I have built does help me in that a lot!
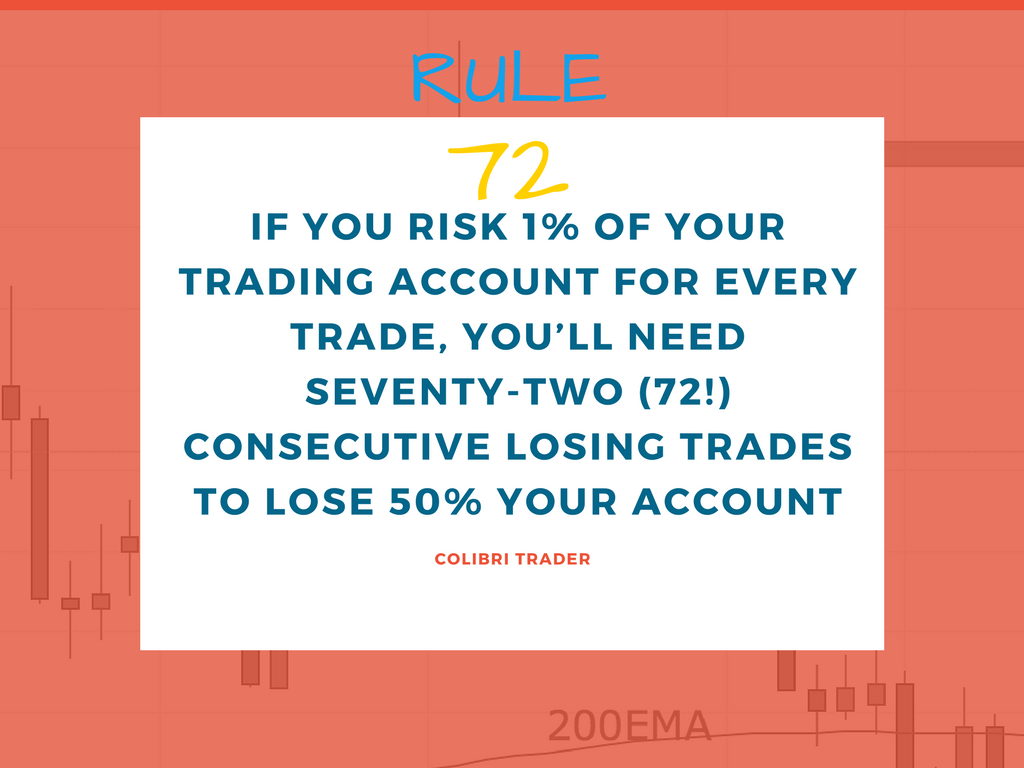
Just remember one very important rule- the 72 RULE:
Example 1
Let’s continue with another example of supply zones and price action.
What you need to consider when trading with supply and demand zones is that the reliability of a signal is often in a direct relationship with its frequency.
In other words, the less often a certain pattern occurs, the higher its reliability could be.
Example 2
Let’s have a look at another supply zone example with price action.
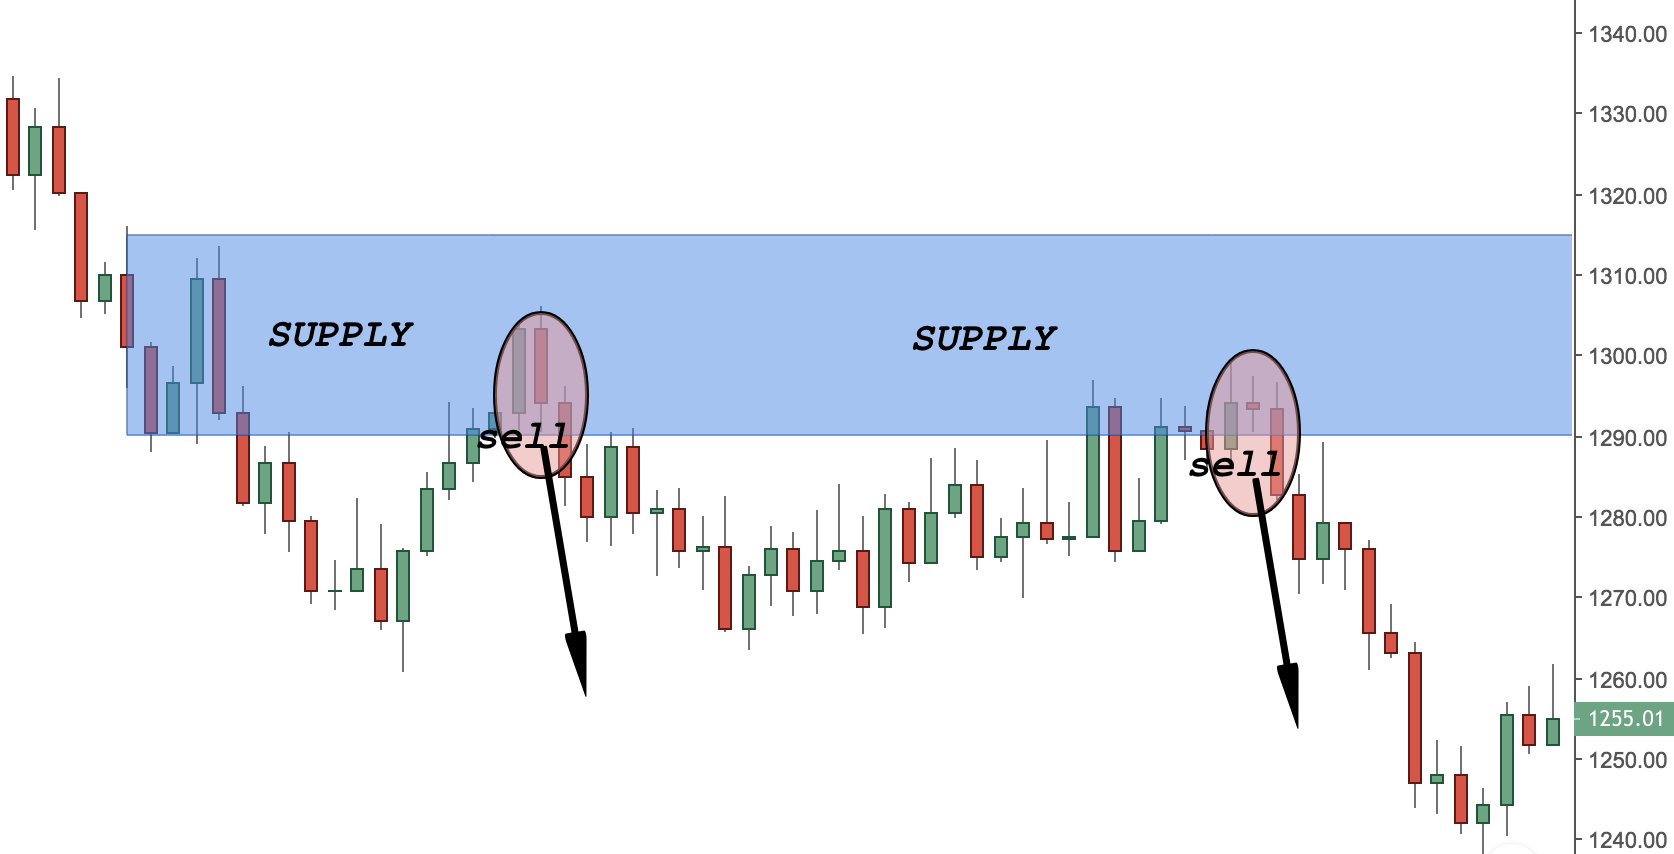
In this example above, I have chosen a supply zone that is in the middle of a range. As you can see, it is as powerful as if it was in the extremities of a range.
The first sell trigger came when price action printed a two-candle bearish engulfing pattern.
The second sell-trigger came when price printed another two-candle bearish engulfing pattern.
It usually takes more experience to see a supply or demand zone in the middle of a range than to spot it at the extremities.
One way or another, location is less important than the zone itself.
It does not really matter where it forms, as long as it forms 🙂
Example 3
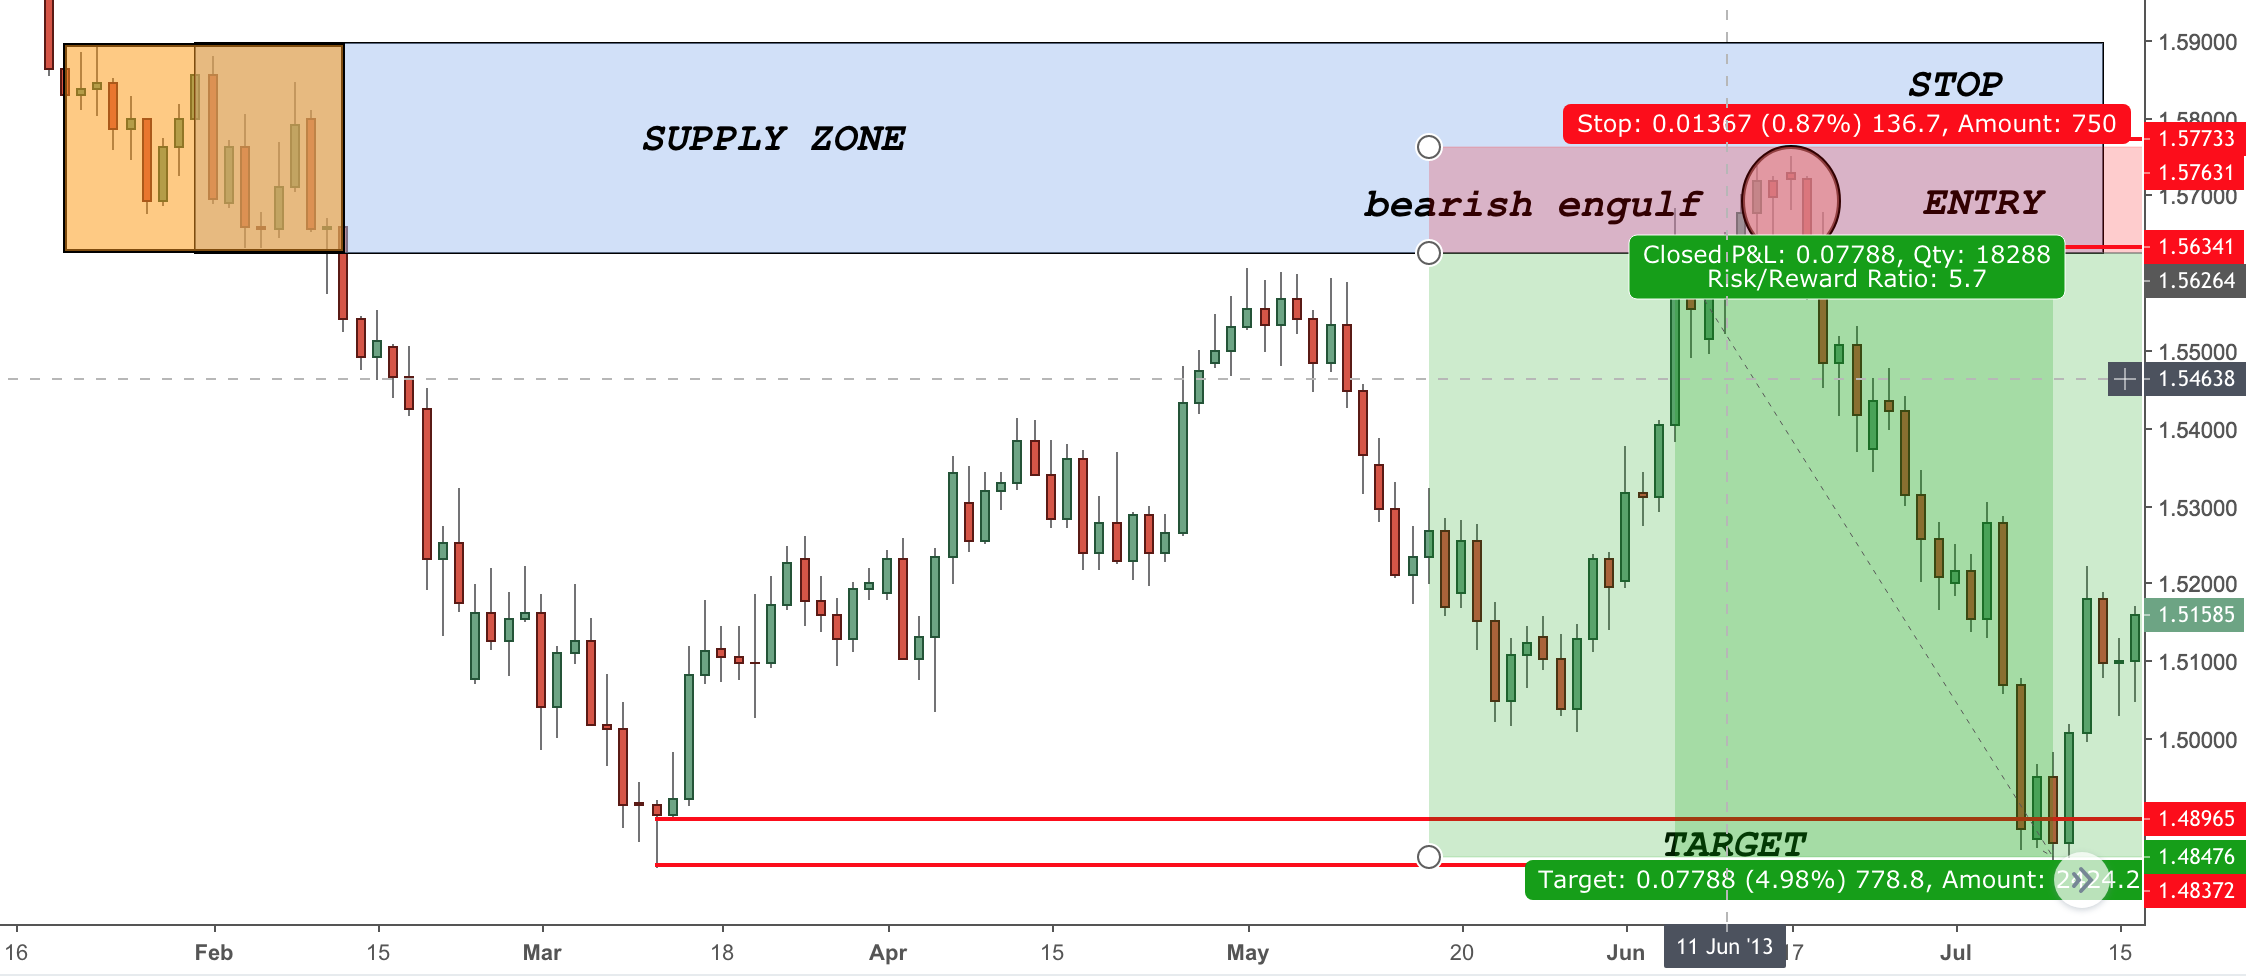
In this example above you see a potential trading setup that would have given almost 1:6 risk:reward ration just from a daily chart point of view.
Considering that you can fine-tune your entry from the 4H chart, this could have been an even bigger winner.
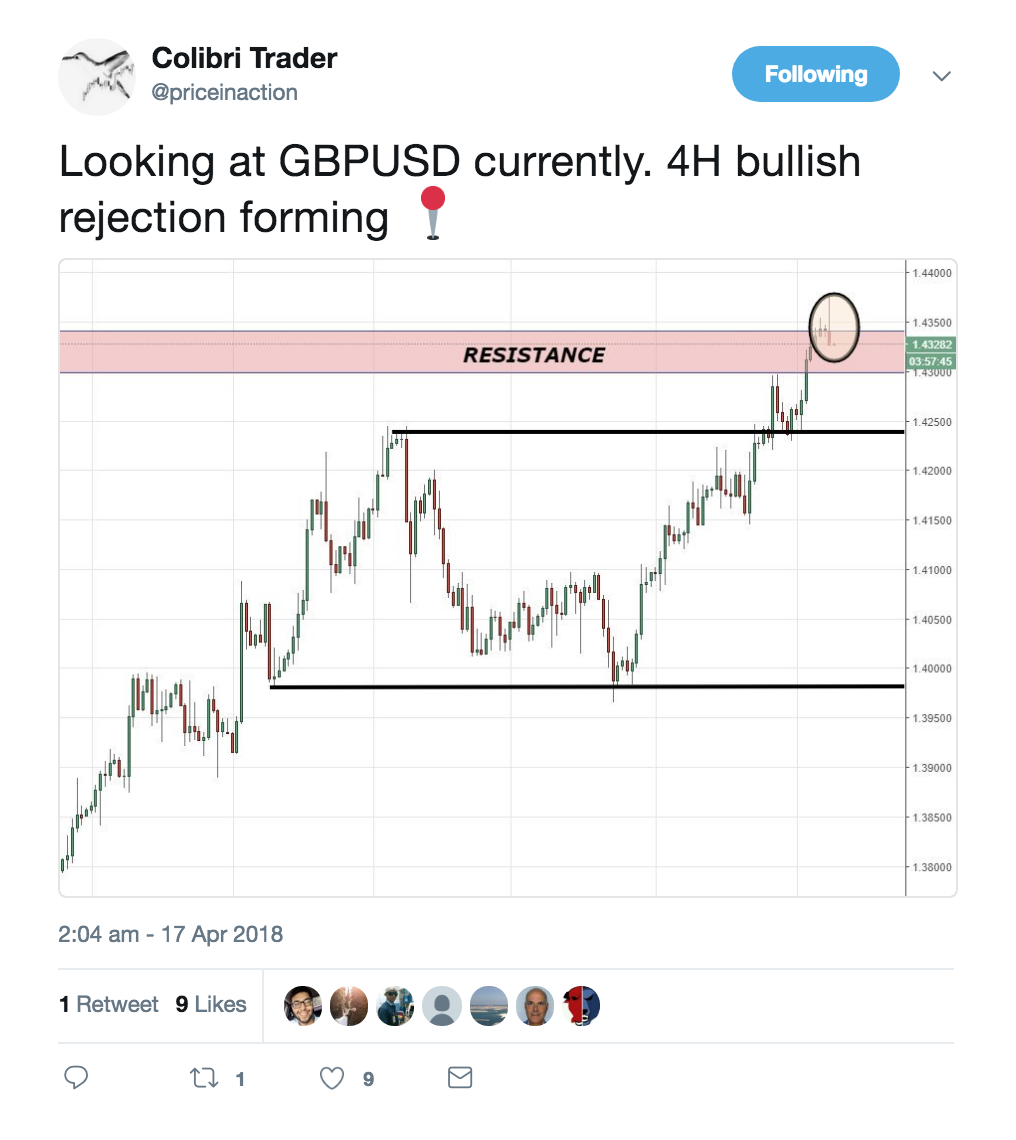
Real Trade That I Shared On My Twitter Account
Let’s have a look at an example of a trade that I took this year and that I shared with my followers on my Twitter HERE.
The rules for taking this trade were the same as explained above.
***For the step-by-step process check out my pro trading course.
Looking at this trade, the potential return from this trade if my rules were followed step-by-step could have been enormous.
Here is the daily view:
Here is the 4H zoomed-in view:
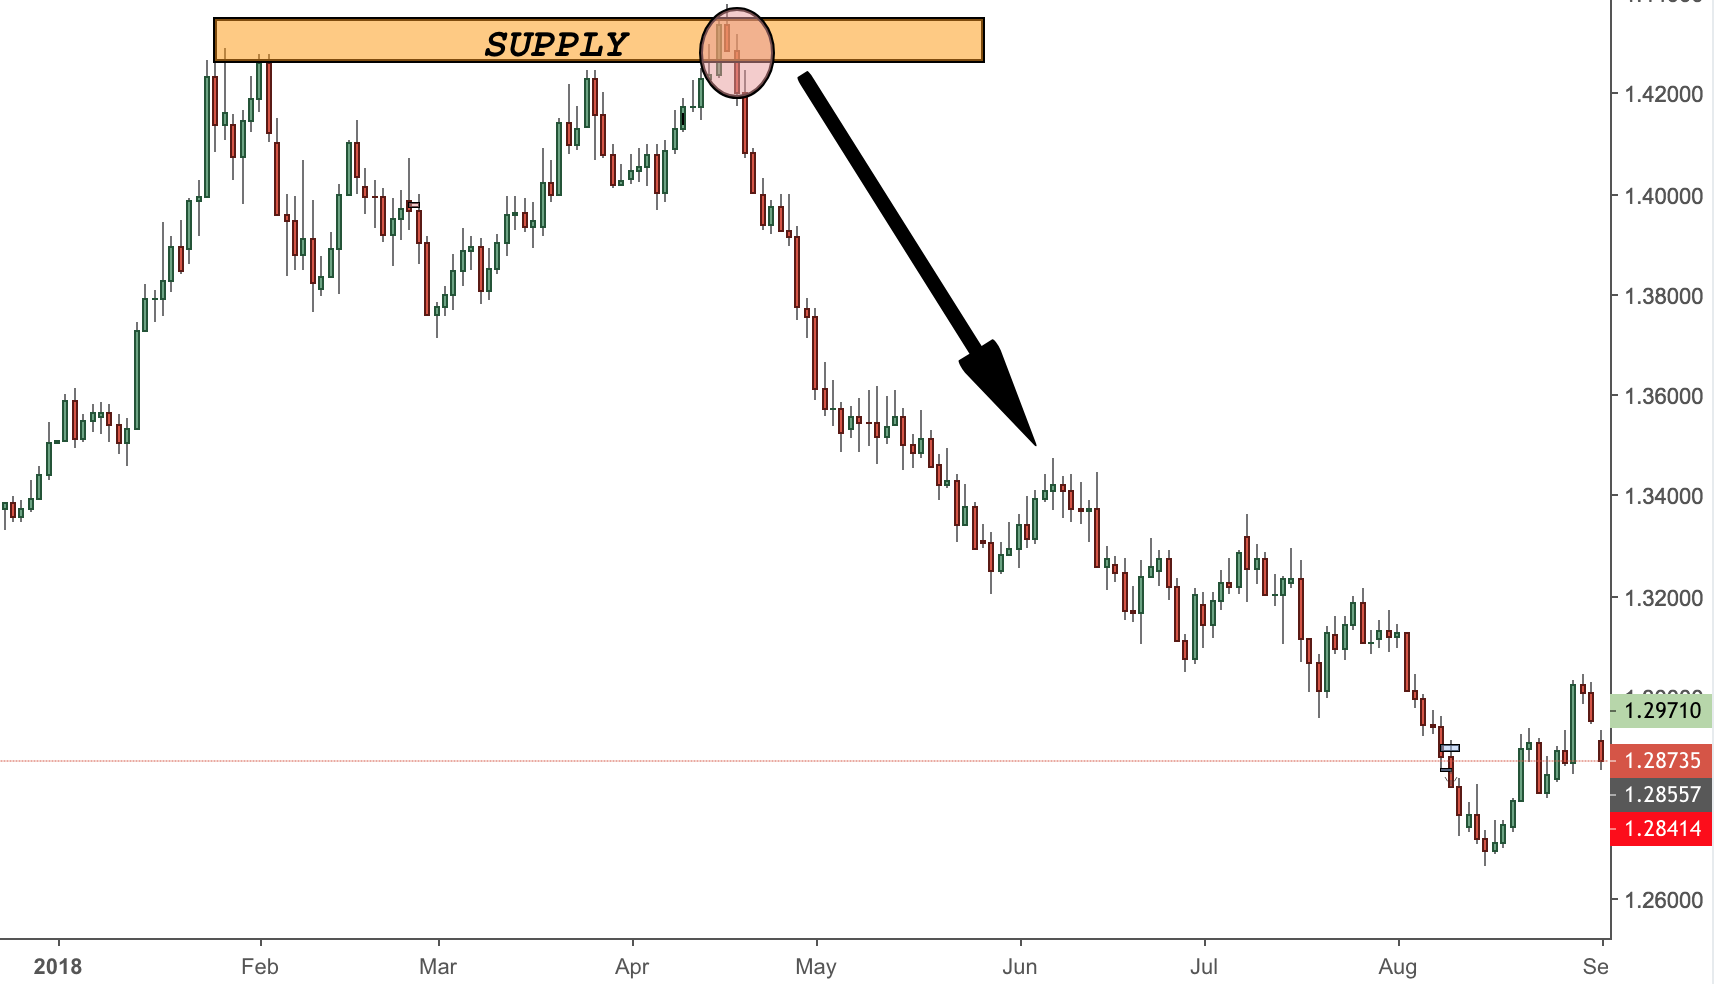
Here is the 4H zoomed-out view:
As you can see from the charts above, this could have been one unbelievable trade if you followed those rules.
I managed to take this trade and stayed within it for quite some time. It is extremely hard to hold onto this trade until the very end, but even with a fraction of this move, you could have made a fortune.
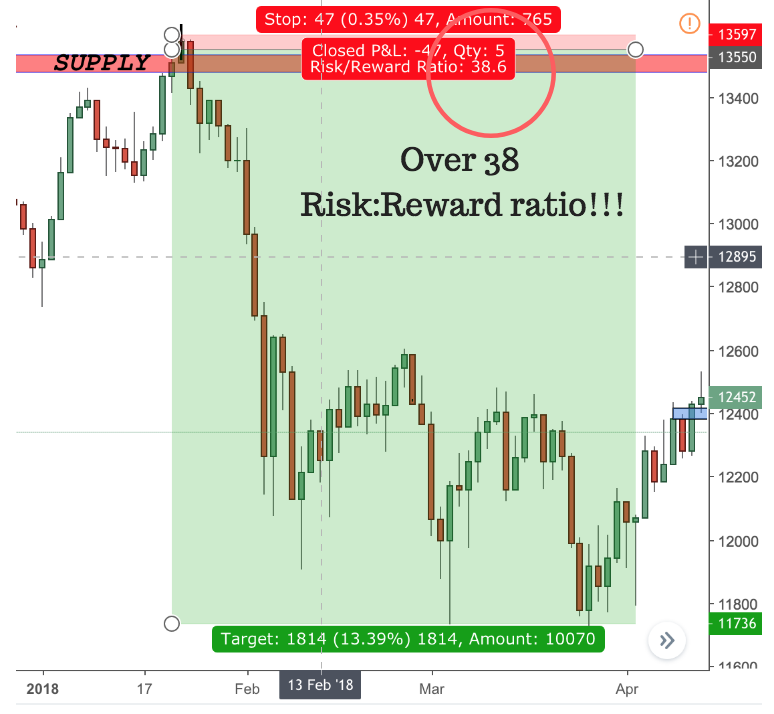
Let’s try to look into a potential risk:reward scenario if you have managed to stay for the duration of the whole move:
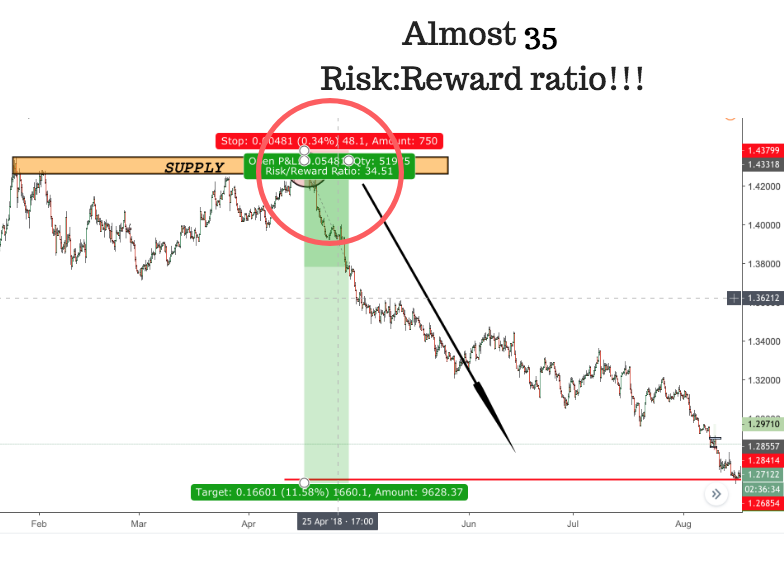
This incredible 1:35 risk:reward ratio is almost unbelievable!
Even if you managed to stay in this trade for just 1/3rd of the move, you would have made over 10 times your risk.
This return is achieved even without scaling in- just from ONE SINGLE TRADE!
I do usually use scaling in with my trading strategy, which would have magnified the trading results!
The beauty of my trading strategy is that it also helps you stay away from unprofitable trades by minimising the effect of the losing trades.
All in all, trading a combination of supply and demand zones with price action does really perform spectacularly well.
Second Real Trade That I Shared On My Website
The second real time example was given on my website on the 24th of January, 2018 HERE.
There was almost an identical setup on the daily timeframe.
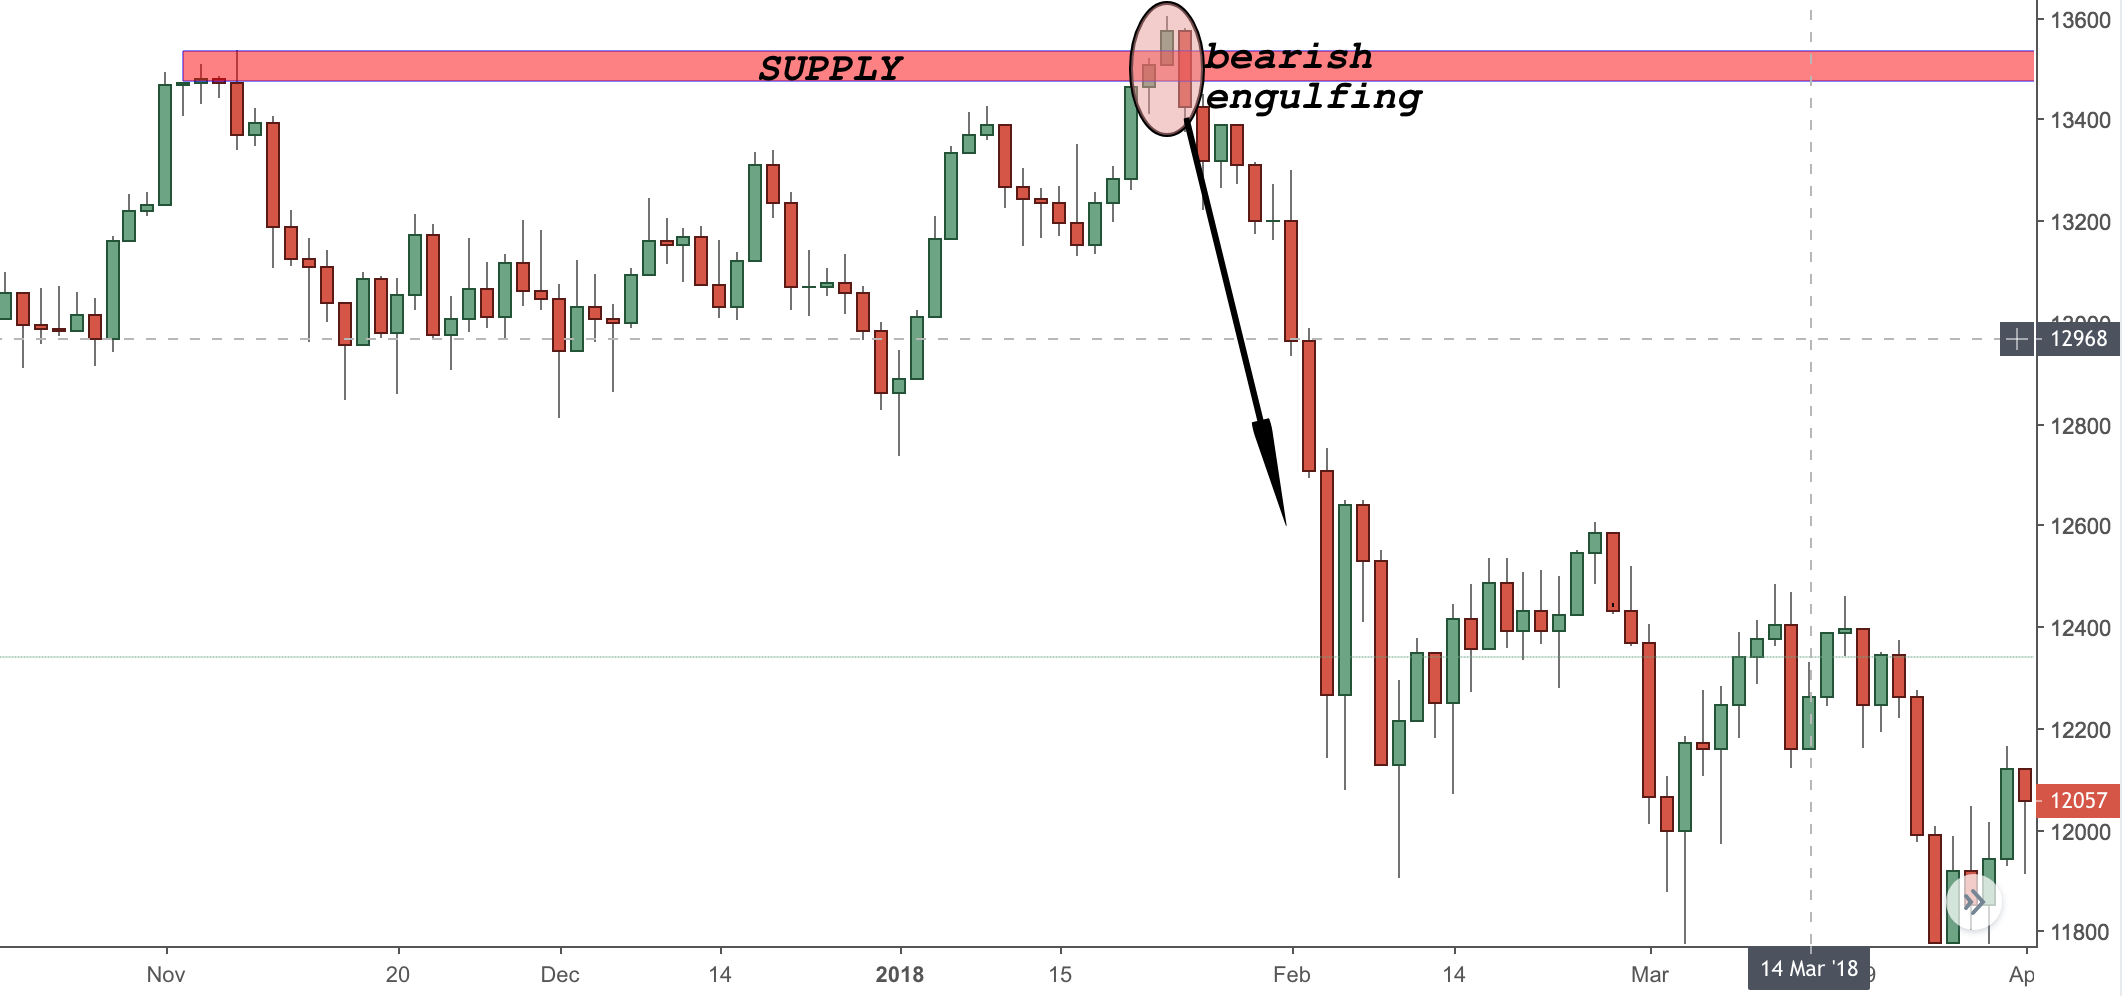
After price formed a bearish engulfing pattern on the daily just around the supply zone, DAX plummeted almost 2,000 points!
If we zoom in the 4H chart, we are about to find out:
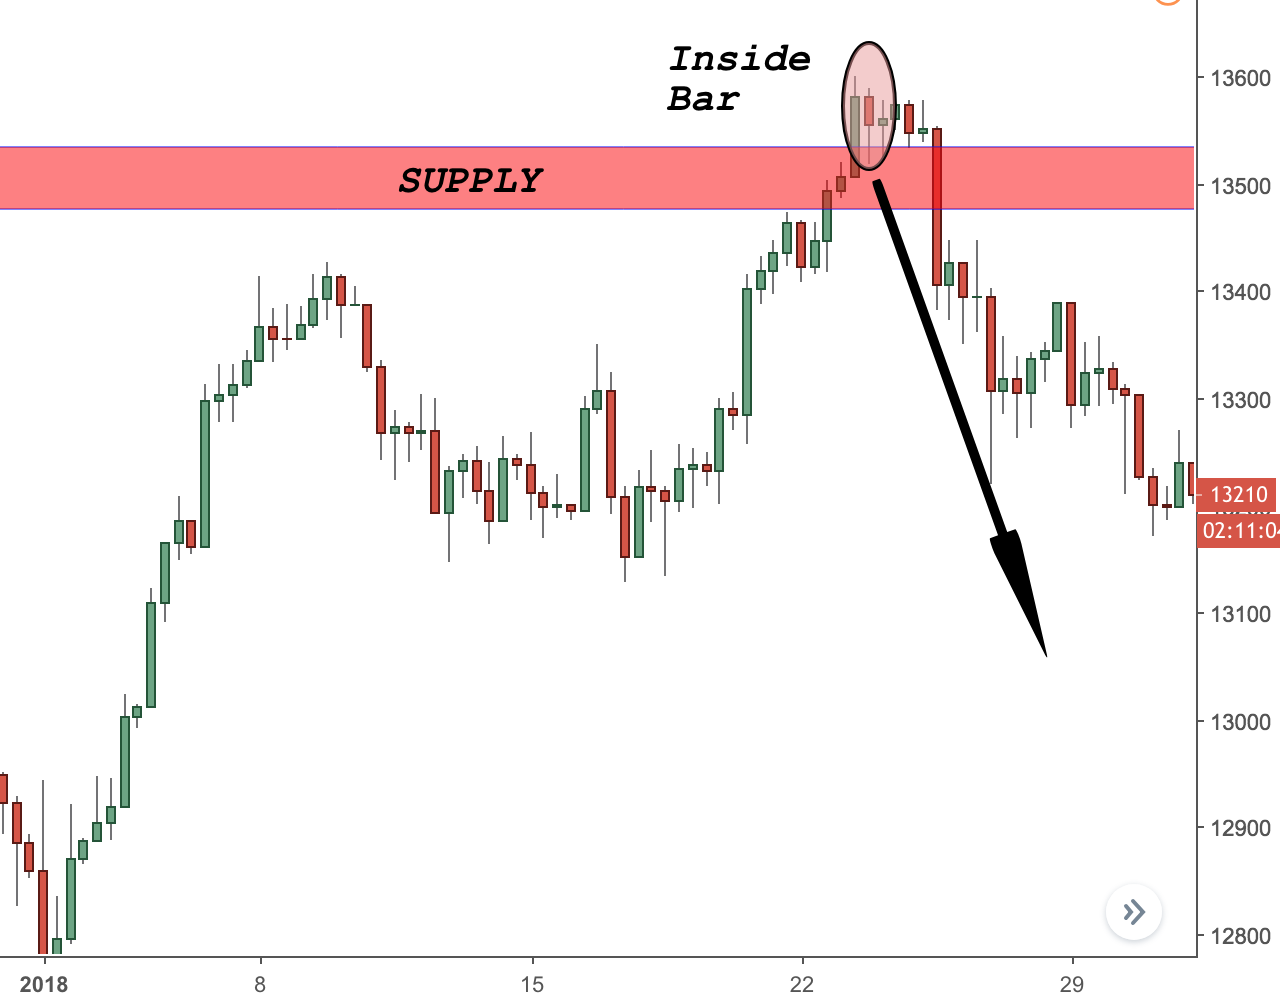
This would have been easily the best trade of the whole 2018! Let’s check out if you traded this inside bar, what would your return have been.
Although very rare, those types of opportunities are worth waiting for!
You might think twice before saying that you are aiming at a 1:2 or 1:3 risk:reward ratio. Much higher multipliers are possible when the necessary conditions are met.
Although it is close to impossible to get the whole move, even if you participate in 1/3 of that trade, you would be raking over 1:10 risk:reward.
Now that is what I call “letting winners run”!
Combined with the rules I am using in my trading strategy, this approach could be very profitable if you are careful enough and apply the right money management rules.
Final Words
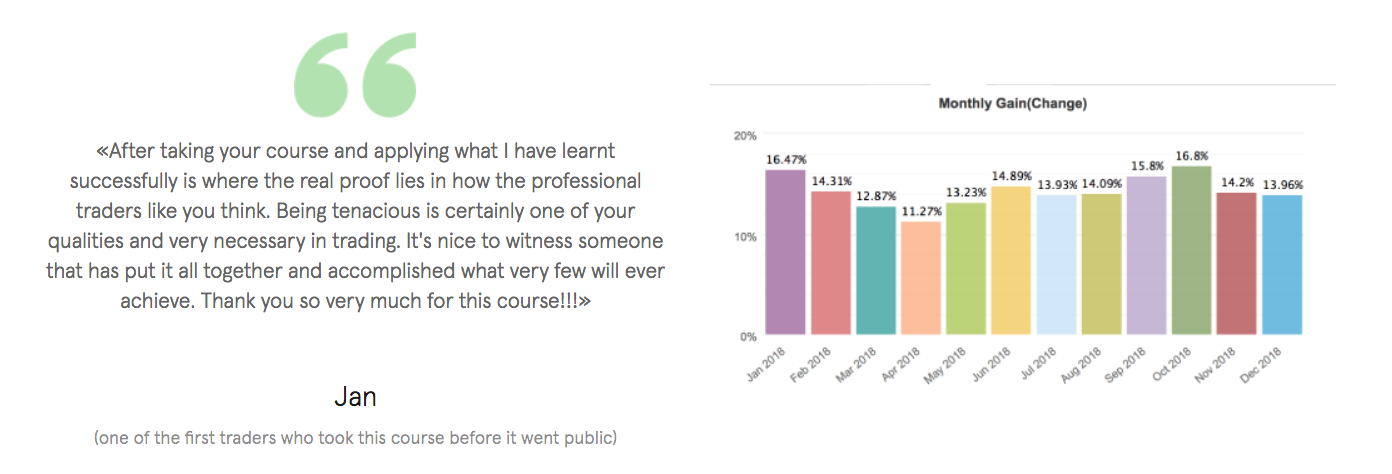
Instead of a conclusion, I would like to remind you to check out my trading strategy, which is based on price action trading and includes elements of supply and demand levels and zones.
Below is the track record of one of my students who enrolled in 2018.
P.S.
In case you still have not checked it already, you can go to my Supply and Demand Zones Part I now.
Heloo sir..
Congratulation for great job Mr.
My challenge is.. In each time, when am just trying to spot zones,, the great challenge for me is to identify base on zones formations Sir.. How do you help me for such thing?
Thankyou.
Hi Teonesmo, it is all in the article- please read it carefully.
Thank you very much for taking your time in teaching young traders like me its really helpful thanks once again
It is totally my pleasure! I am honoured and humbled to have helped traders like yourself!
Hi colibritrader, just a question, in the descriptions of bull and bear traps with supply and demand as good indicators, wouldn’t it be bull traps with supply zones and bear traps with demand zones?
Hi Ben, that is correct! Usually it is the case. I have a very detailed record of what to do and which setups are better than others in my supply and demand course. Let me know if I can help with something else! Colibri
nice and interesting post…
Thank you! Let me know if you have any questions
Gracias por compartir su conocimiento, muchísimas gracias
Glad it helped you!
Thank you very much Mr. Colibritrader for your invaluable info towards Supply and Demand trading strategy. It gave me nice knowledge about spotting zones.
I would like to get more info about your course. Please let me know on my email: muneerbasha3@gmail.com
Afternoon.
How much is the course?
It is currently reduced to 497USD. If you need more information send me an e-mail at admin@colibritrader.com
Loud and clear
This is very useful and helped in trading…
Thanks Suraj. Have you read the other supply and demand related articles?
quick question. for test demand zone which candle must be appear red or green candle . what if whole candle touch the demand zone without wick on distal line ,does it consider rejection? if i saw demand zone in Day chart , still i have to go small time frame or not. when should i go small time frame ? your expedite reply would be wonderful. thank you
Pls I want to get the PDF file of this. I love it. Please sent it to my email
Hi, can you email me please so that I can send it to you.