


8 TrendSpider Tips and Tricks for Traders
Tips and tricks for Trendspider– let me walk you through some of the most discussed features of this innovative trading platform.
TrendSpider is an up and coming technical analysis platform built by traders, for traders.
Aside from the usual technical indicators and drawing tools, the platform features:
- automation
- scanning
- backtesting
- alerting
- other capabilities that truly set it apart and make it a valuable part of any active trader’s toolbox.
Many of these features are possible with programmatic trading platforms, such as TradeStation or MetaTrader but there’s a steep learning curve.
TrendSpider provides an easy-to-use strategy builder that requires no programming knowledge.
Let’s take a look at some tips and tricks that can help you get the most out of the platform.
Table of Contents
Contents in this article
1. Getting Started
TrendSpider has an intuitive user interface for anyone that’s familiar with TradingView or other web-based charting platforms.
The user interface is divided into four sections:
- The top menu bar lets you toggle different features discussed below, such as automated trend lines, multiple time frame analysis and candlestick pattern recognition. You can also toggle the Strategy Tester and Market Scanner.
- The left sidebar contains the drawing tools that you can use to mark-up the chart. They range from trend lines and Fibonacci drawing tools to text and arrows.
- The right sidebar contains different widgets, including your watchlist and alerts. You can also configure your own smart watchlists to appear in this area.
- The main charting window contains the price chart and any technical overlays and indicators. Also, the ability to toggle different time frames, chart types and other settings that influence the look and feel of the chart.
Download TrendSpider’s Tips and Tricks Spreadsheet Now
If you’re a customer or free trial user, you can also sign up for a free one-on-one training session.
2. Embrace the Automation
Everyone has their own way to mark-up charts and identify opportunities.
These processes are often highly subjective, time-consuming and error prone.
TrendSpider is all about using automation to eliminate grunt work and remove bias, emotion, social influence, fear-of-missing-out (FOMO).
By removing these factors, you can improve your consistency and performance.
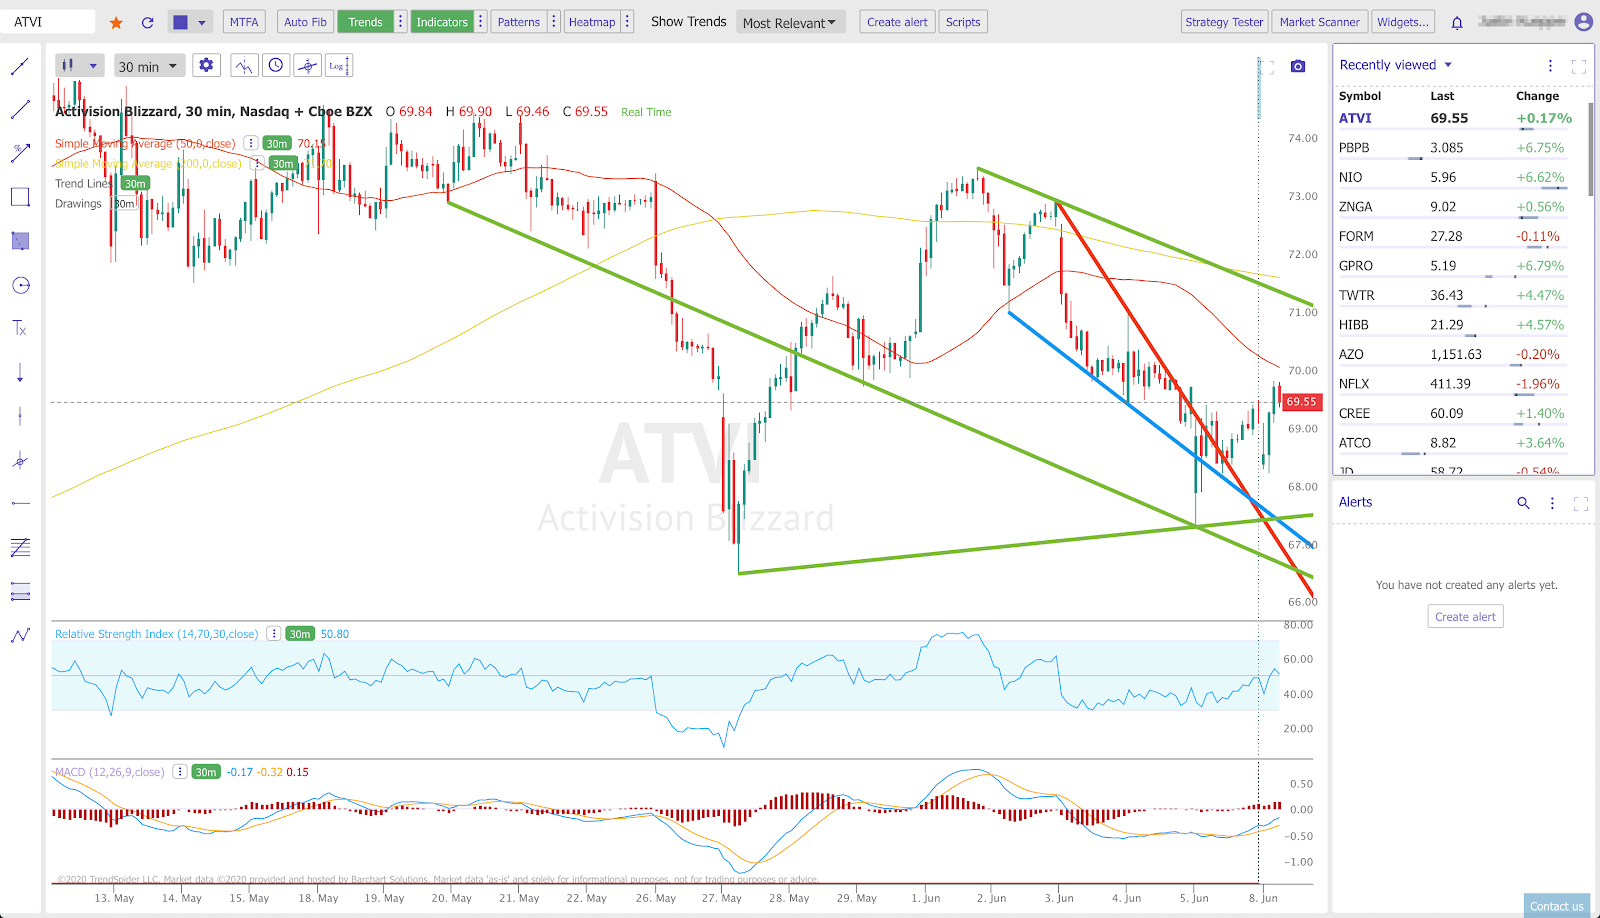
You can automatically draw trend lines by clicking on the Trends button in the top menu bar.
If you’re not happy with the defaults, try using the Show Trends dropdown to change the number of trend lines.
Extra TrendSpider Trick: Alternatively, you can adjust the Analysis Type settings in the Trends dropdown menu.
If one or two trend lines look out of place, hold down shift and click to remove them or right click on them and remove them from that menu.
3. TrendSpider Tips and Tricks- Patterns
You can automatically identify candlestick patterns by clicking on the Patterns button in the top menu bar.
It highlights any instances directly on the price chart.
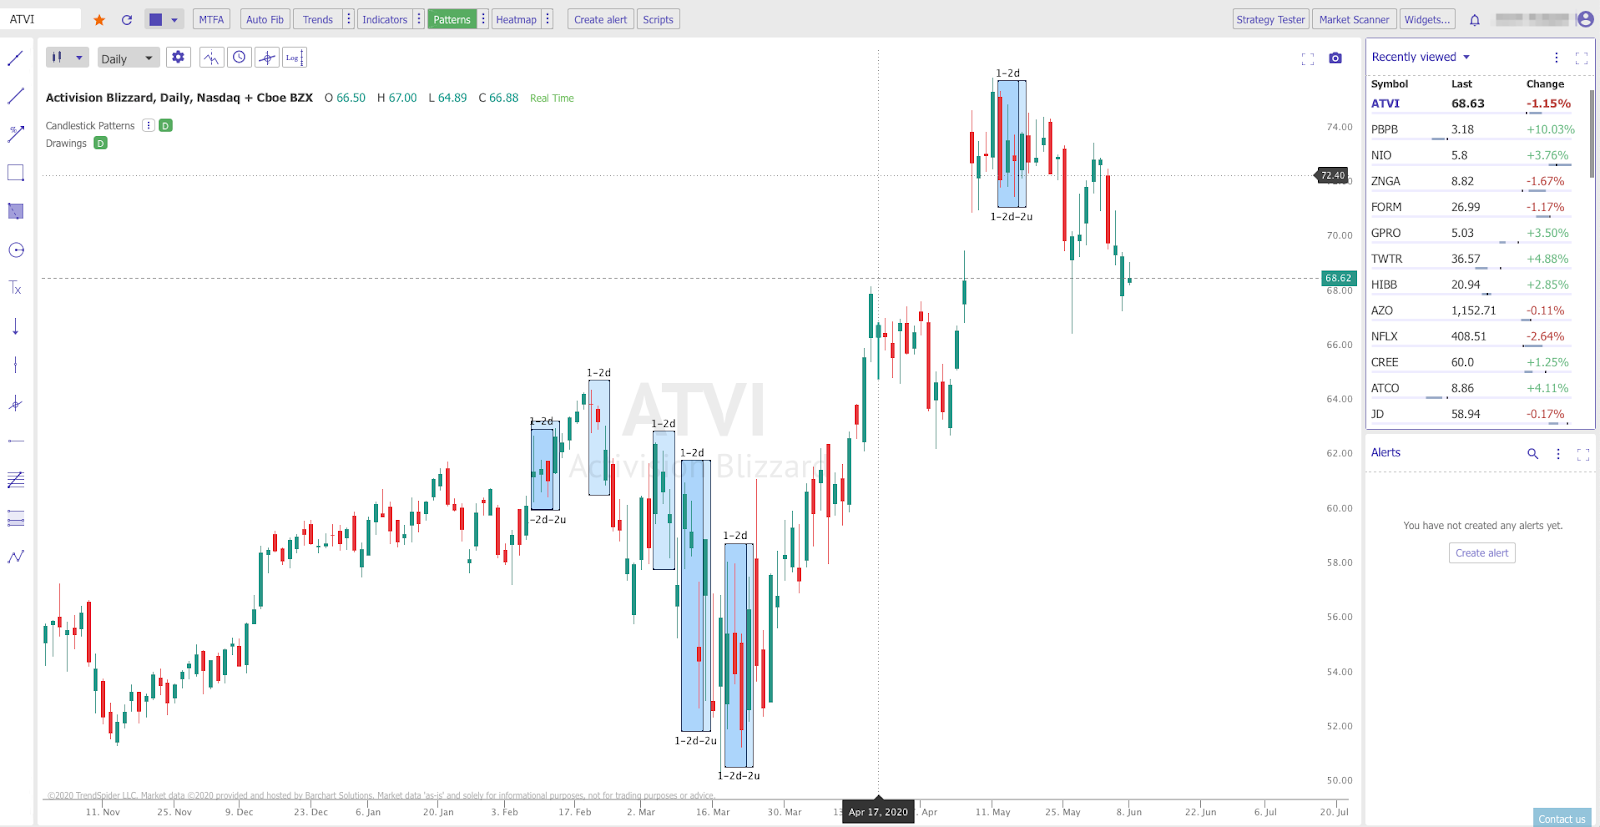
In the Patterns dropdown, you can customize the candlestick patterns that you want to appear on the chart.
There are hundreds of different patterns to choose from and any instance is instantly highlighted on the price chart.
Users can even use strategies from TheStrat, The Pattern Site, Newsome Candle and a growing list of other off-the-beaten path strategies.
Traders can even request new chart patterns.
3A. TrendSpider’s Tips & Tricks- Technical Analysis Automations
You also have access to several other technical analysis automations like:
- Automatic Fibonacci
- Breakout Detection
- Support and Resistance Detection
While automated technical analysis and charting is a time saver.
TrendSpider’s greatest feature is arguably its multi-factor alerts that can automate complex strategies.
Traders can create an alert by clicking on the Create Alert button in the Alerts section of the right sidebar.
You can build nearly any technical analysis strategy using a simple visual interface.
Traders can configure dynamic alerts that fire when the conditions are met.
Alternatively, you can use one of TrendSpider’s pre-built alerts as a starting point or inspiration.
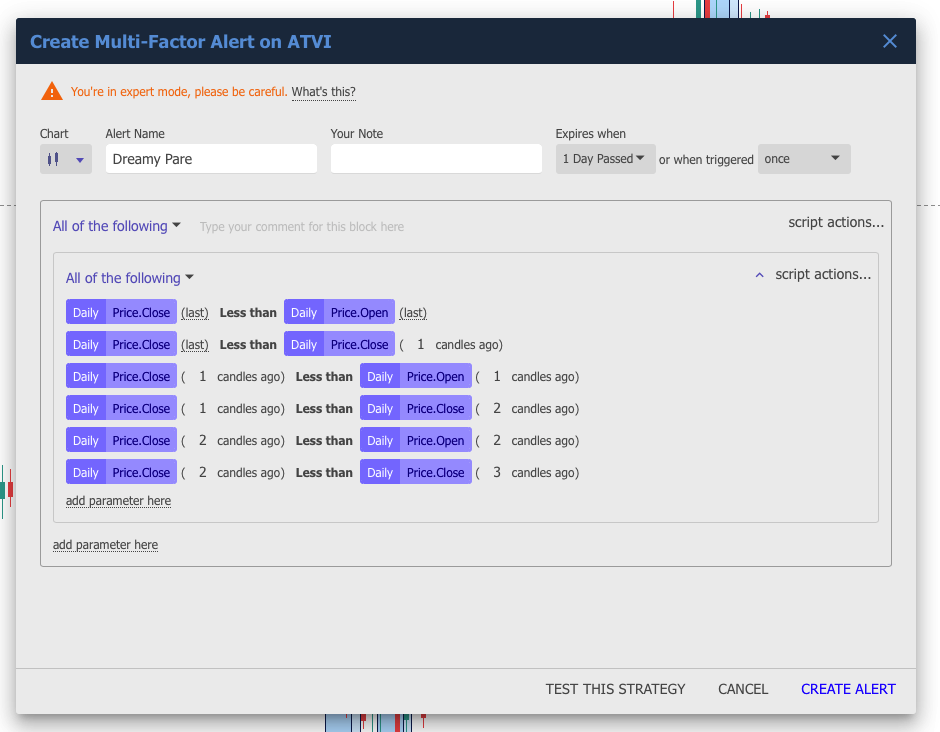
3B. TrendSpider Tips and Tricks- Moving Averages
You can create an alert that fires when the 50-day MA crosses above the 200-day MA while the RSI is below 50.
This can be done only during the beginning of the trading day.
You can even set dynamic alerts based on trend lines that you draw, complete with buffers to define how close the price needs to get to trigger the alert.
These capabilities are perfect for traders that commonly use chart patterns, such as channels or ascending triangles.
The easiest way to create these alerts is to right-click on a trend line and select Create alert at this line.
You can then specify whether the alert should trigger from a break through, touch or bounce, as well as set sensitivity and other factors.
Special TrendSpider Tip: Traders can configure alerts to send via SMS, email and in-app notification, so you never miss another trading opportunity again!
3. Peak Across Timeframes
We have all found the perfect opportunity in one time frame only to zoom out and see it fall apart.
In other cases, you may want to find short-term entry points for long-term trades, which requires technical analysis across multiple timeframes.
Wouldn’t it be nice to see everything on a single chart?
TrendSpider’s Multiple Time Frame Analysis (MTFA) makes it easy to combine trend lines and technical indicators across any two time frames.
That way, you always have some context when you’re looking at short-term time frames and see trends that other traders would almost certainly miss.
You can enable multiple time frame analysis capabilities by clicking on the MTFA button in the top menu bar.
Then, you can change the two time frames being compared using the two dropdowns at the top-left corner of the chart.
So Many Timeframes…
TrendSpider supports 1, 2, 3, 4, 5, 6, 10, 12, 15, 30, and 45, 60, 65, 90, 120, and 240 minute, daily, weekly and monthly time frames.
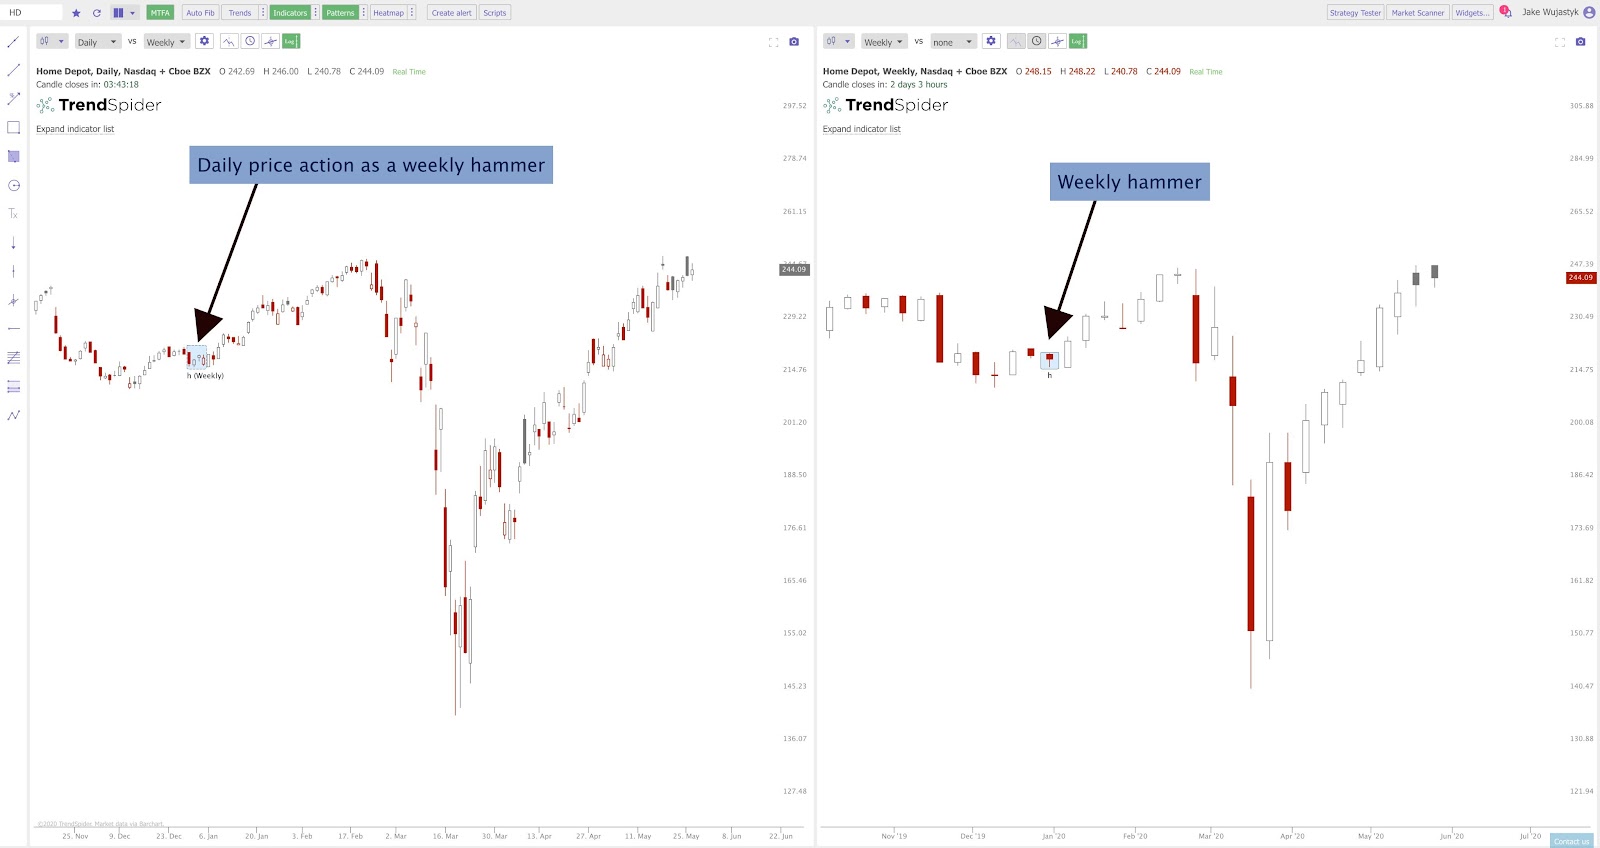
In addition, many technical indicators will show you values from both time frames on the same chart.
For example, an oversold RSI reading in a longer time frame could support a bullish bias in short-term trading opportunities.
The first time frame’s indicator lines appear as they normally would, while the second time frame’s indicator lines appear as a dashed line.
Both on the chart and in upper and lower sub-charts—making it easy to differentiate between them.
You can change these behaviours using the Accent menu item in the top-left corner of the chart.
4. Scan for Opportunities
Time is precious and traders spend too much of it flipping through charts trying to find opportunities.
While there are some basic technical scanners out there, they are often limited to a handful of built-in strategies…
Or they require programming knowledge.
TrendSpider’s Market Scanner makes it easy to find opportunities using technical strategies that you’ve designed or a number of built-in strategies.
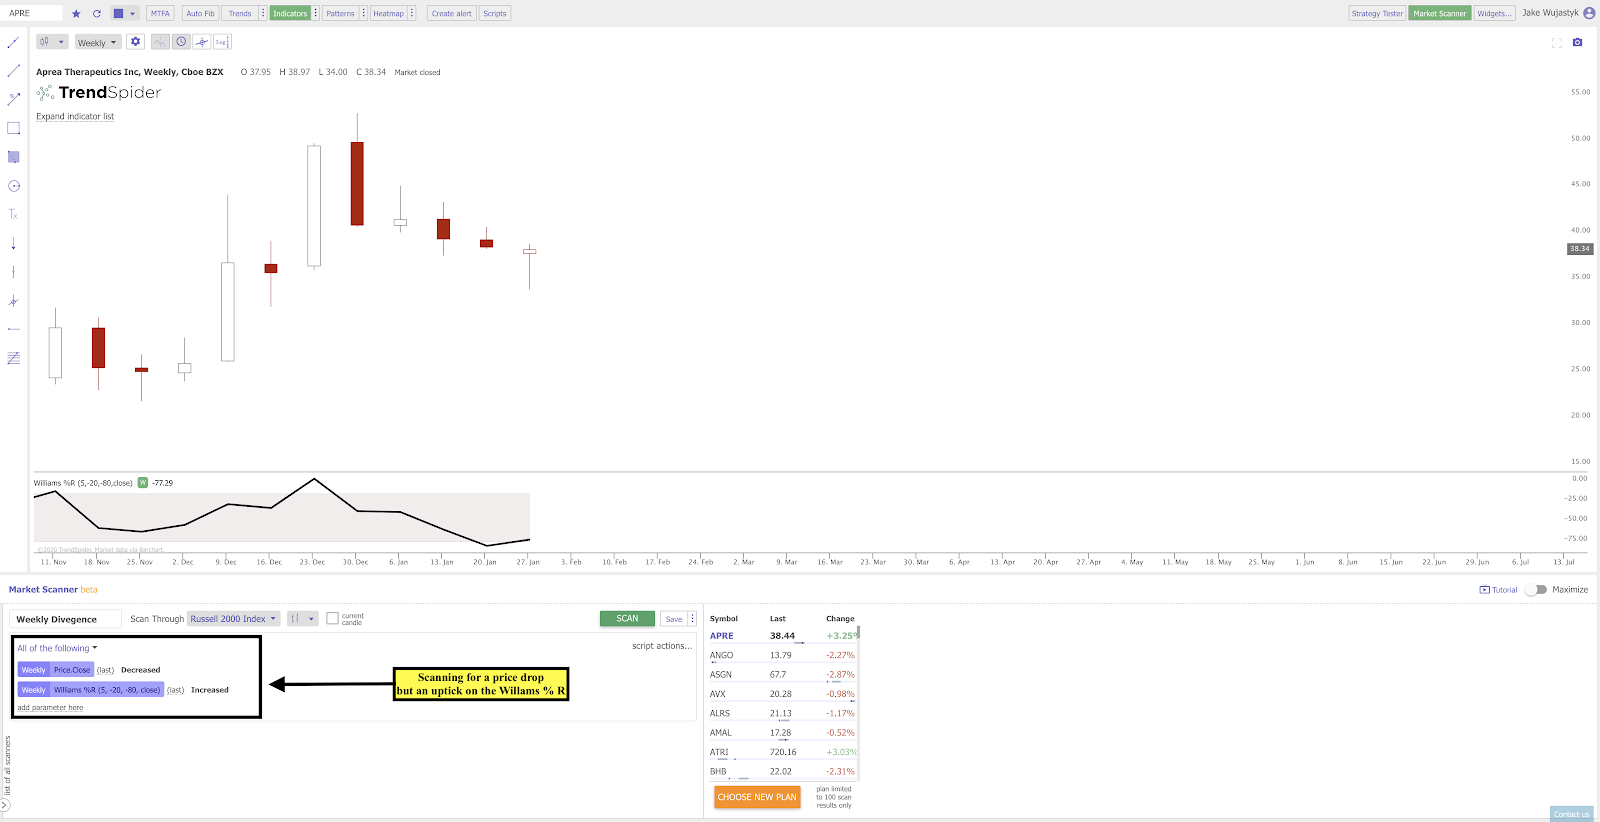
Start by clicking on Market Scanner in the right side of the top menu bar.
In the scanner window, you can search for pre-build scanners.
You can build a new scanner in the same way that you would build a multi-factor alert (discussed above).
4A. TrenSpider Tips and Tricks- Variables
TrendSpider provides access to a huge number of variables that you can use to filter down watchlists to very specific opportunities.
Traders can run scans on indicators, patterns or price action from a 1-minute and up granularity
It is possible to even combine up to five different time frames into a single scan.

This provides a level of depth that’s not seen in many other market scanners.
Once you’ve built or selected a scan, you can run the scan against common indexes and industries.
4B. TrendSpider’s Tips and Tricks- Watchlists
Traders can run that against their own watchlists to find opportunities, as well.
You can then save the scan results into a new Smart Watchlist or simply run through each item on its own.
Smart Watchlists, available as a widget in the right sidebar, enable you to quickly view the results of a prebuilt scan.
Rather than going into the scanner each time, you can click the refresh button on these watchlists to get the latest scan results at any time.
5. Backtest Your Strategies
Backtesting is typically a feature designed for algorithmic traders that have the time and expertise to programmatically define their trading strategies.
TrendSpider lowers these barriers and makes backtesting available to any trader!
You can quickly see how any strategy would have performed in the past with statistics that range from max drawdown to the number of positions.
It is easy to see and to understand visualisations that quickly convey the information that you need.
The combination of in-depth statistics and visualisations set it apart from anything else in the market.
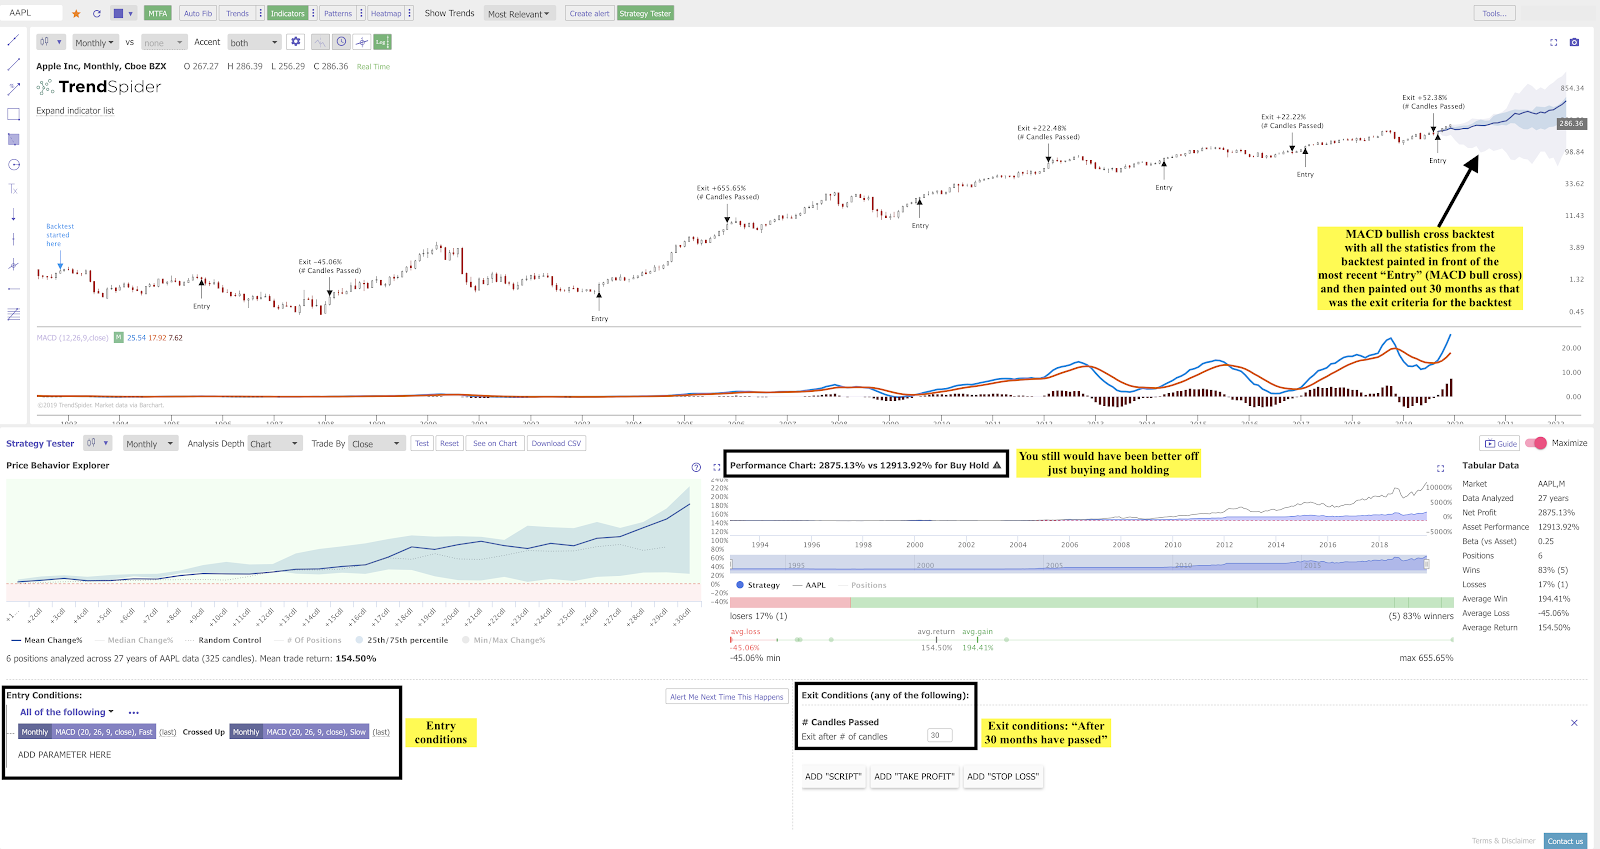
Start by clicking on the Strategy Tester button on the right-side of the top menu bar.
You can define entry and exit conditions in the same way that you create multi-factor alerts.
In fact, you can even use alerts that you’ve already created and backtest them against historical data to see how they would have performed.
Or, better yet, you can backtest strategies before turning them into alerts to ensure that they work!
After you click Test, you will see a lot of valuable statistics.
5A. TrendSpider Tips and Tricks with Tabular Data
The tabular data table on the right shows you a lot of the standard data that other backtests would show, such as:
-the net profit
-win/loss ratio
-max drawdown
-average returns.
These are all helpful data points for determining if a strategy generates enough alpha to be worthwhile.
The chart of the left shows you how the price tended to behave after the entry and compares that to randomised trades to give you an idea of alpha.
On the right, the chart shows you the performance of the strategy over time compared to the asset price.
You can also see the distribution of returns to visualise how they would have performed.
In addition, you can show the would-be trades directly on the price chart by clicking on the See on Chart button.
By plotting the trades, you can see how the latest trade is expected to perform based on the historical performance of the strategy!
6. Try Out Raindrop Charts
You’ve probably never heard of Raindrop charts—and that’s because TrendSpider invented it.
While they are still experimental at this point, they provide another dimension of insight into each candle’s price action that’s worth checking out.
These are the kinds of innovations that really set TrendSpider apart from other technical analysis platforms.
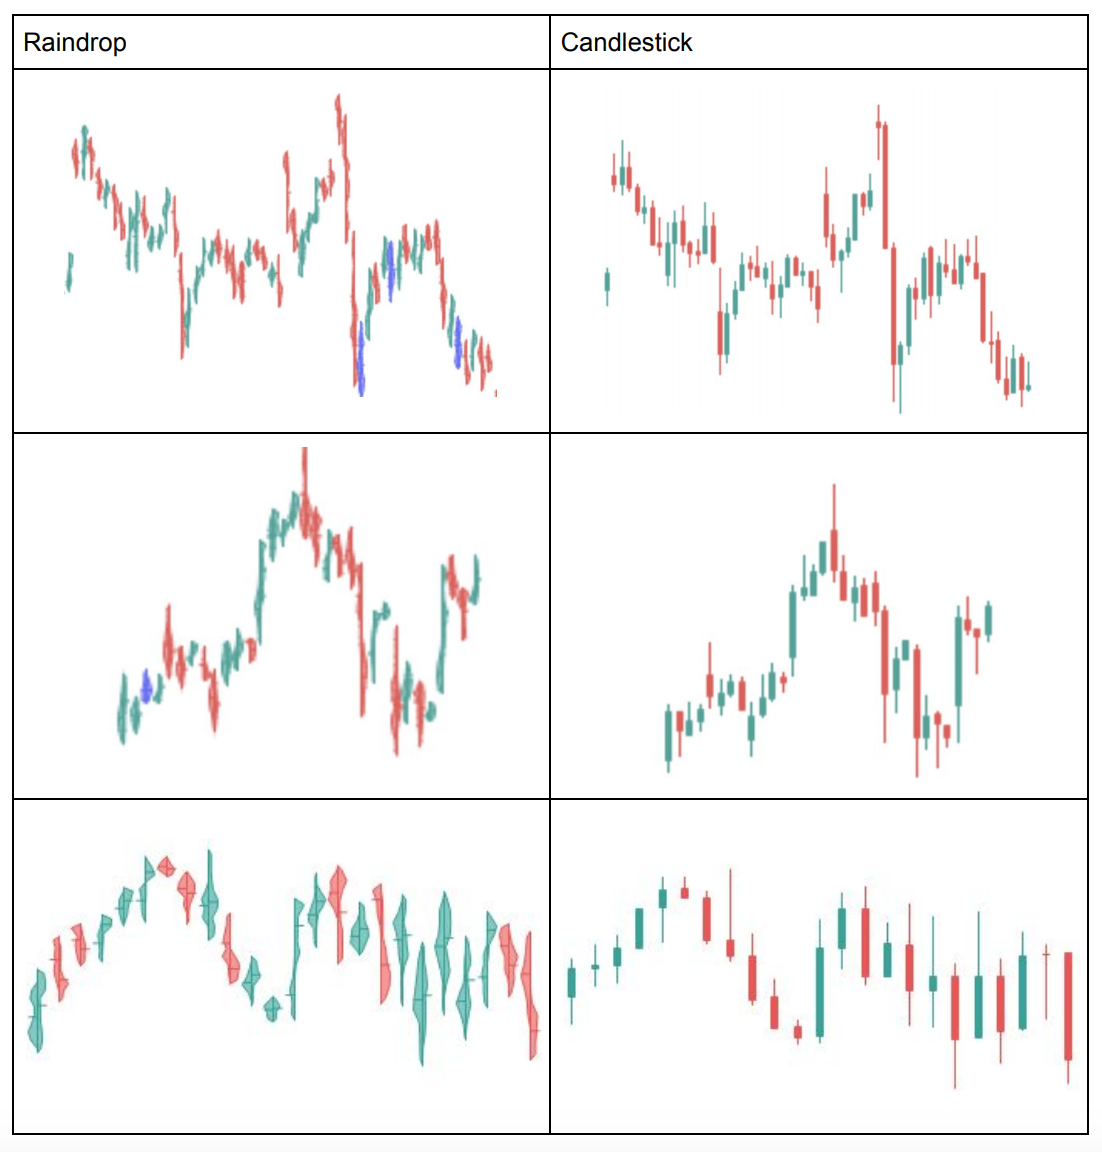
Raindrop charts incorporate volume directly into each price bar using rendered histograms and volume weighted average prices (VWAP).
You can visualise where the price moved and how long it took to get there, and more importantly, how volume flowed during the price movement.
After all, huge movements on a little volume are a lot less important in the long-run than relatively modest moves on large volume.
The first half (left side) of each Raindrop represents the first half of the trading period, the second half (right) represents the second half.
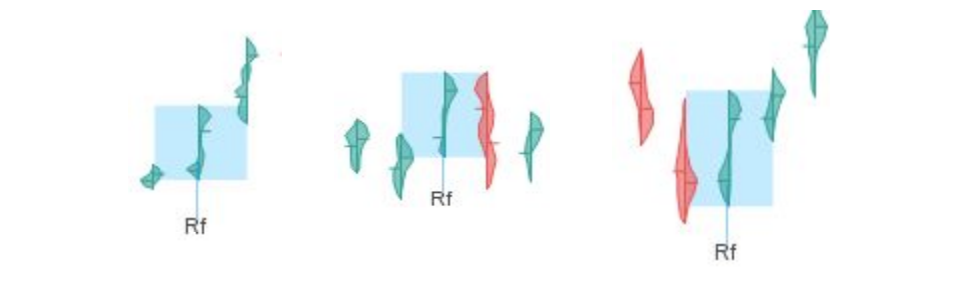
The width of each side represents the amount of trading volume that occurred at each price level.
You can easily see when the price action was most intense throughout the day and what prices drew the most trades.
Check our our Raindrops’ PDF below to learn more about the theory behind Raindrop charts and why they may be useful.
Download TrendSpider’s Tips and Tricks Spreadsheet Now
6A. TrendSpider Tips and Tricks- Raindrop Charts
6A. TrendSpider Tips and Tricks- Raindrop Charts
There you will also learn some strategies that the TrendSpider team believes may be impactful when using the new charts.
You can enable Raindrop charts by clicking on the Chart Type icon in the upper-left corner and selecting the Raindrop.
In practice, you can use the same technical analysis tools on Raindrop charts that you would with candlesticks or any other charts.
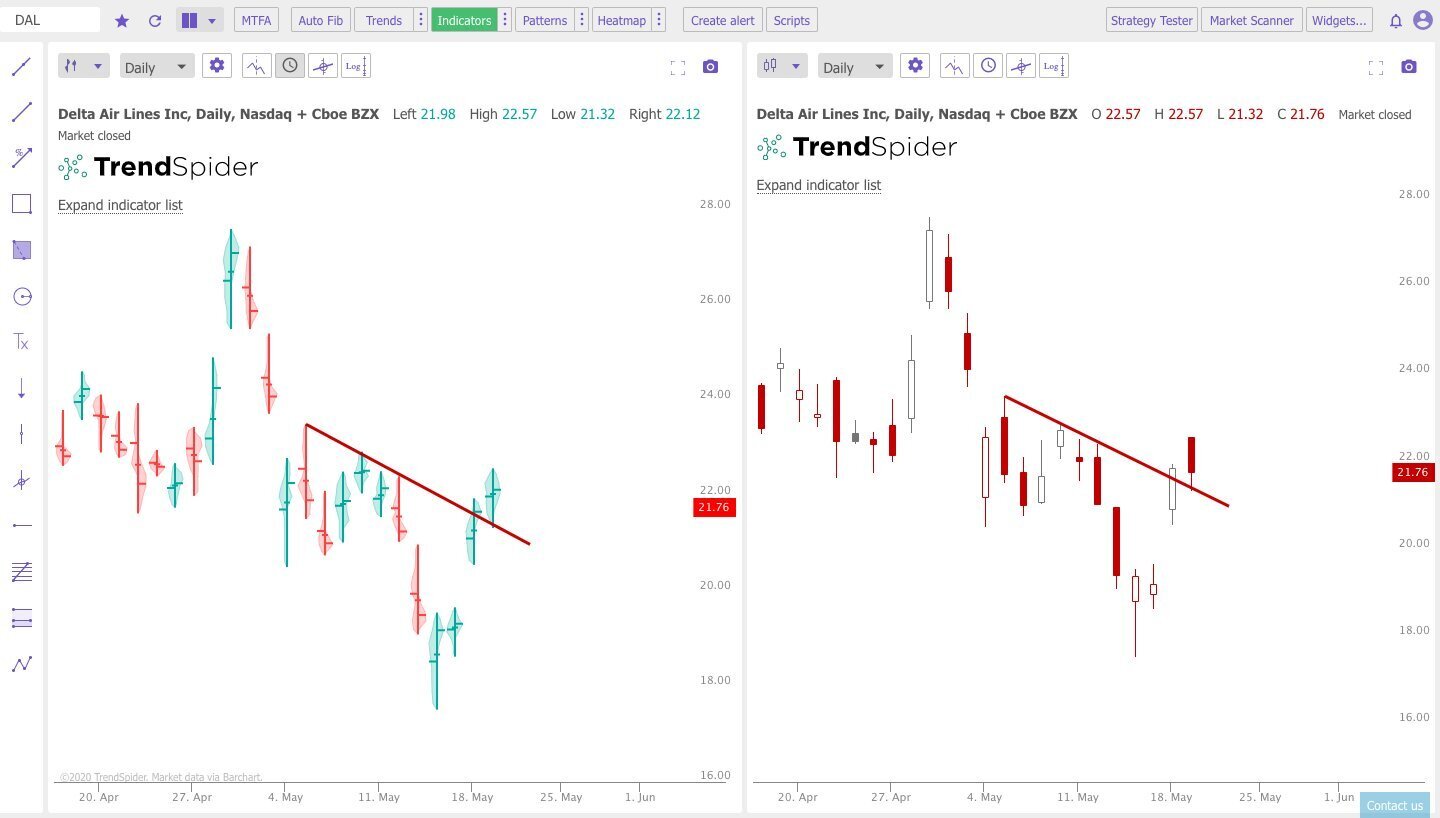
Here is a comparison chart between the two:

The actual data remains the same for each period (open, high, low and close).
All of the calculations are the same, and trend lines are similar because the highs and lows are the same as candlestick charts.
Raindrop charts can be used in lieu of candlestick charts to provide greater insight into the market.
TrendSpider has published some Raindrop-specific patterns and strategies that could make them even more useful in the future.
7. Leverage the Premium Indicators
TrendSpider provides access to a number of premium indicators that go above and beyond the standard affair that many charting platforms provide.
For example, heat maps provide a look into where volume has concentrated in the past.
These price levels could be areas of important support and resistance that aren’t necessarily easy to find when looking at a volume histogram.
You can activate heat maps by clicking on the Heatmaps button in the top menu bar.
Heat maps lines will appear to the right of the price chart then.
You can also experiment with three different types of heat maps to find what works best for you.
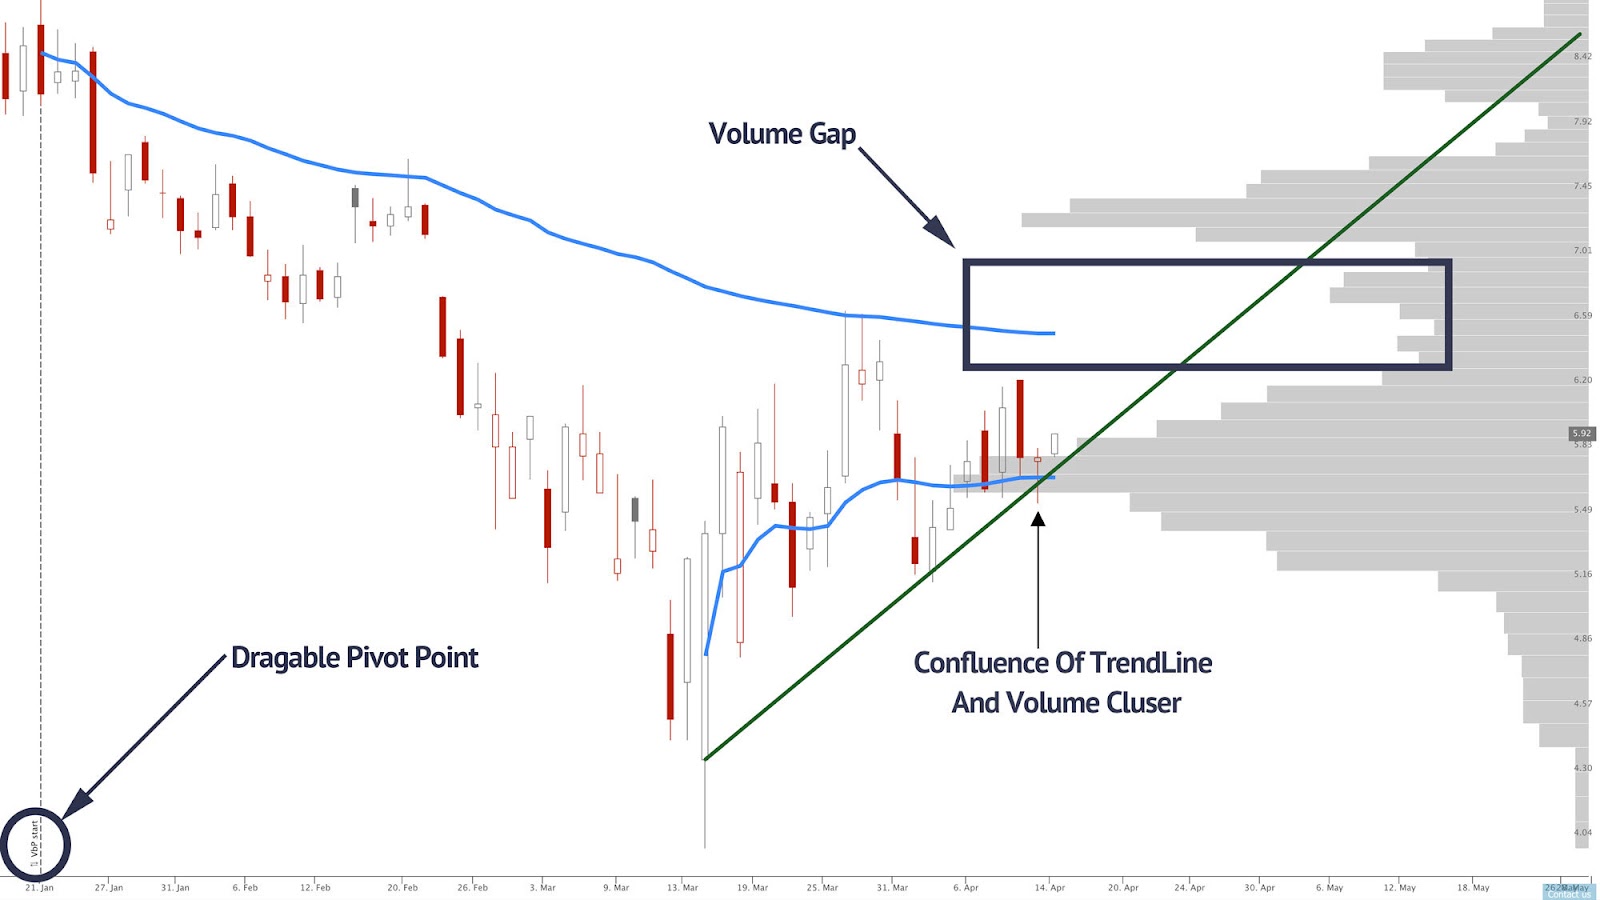
Other popular premium indicators include:
- Anchored Price by Volume (pictured above)
- Alphatrends Anchored VWAP
- Gap Detection
Download TrendSpider’s Tips and Tricks Spreadsheet Now
8. Getting More Out of TrendSpider
8. Getting More Out of TrendSpider
TrendSpider is one of the most innovative charting platforms out there both in terms of:
-Product innovation
-Frequency of updates.
All of these features can be overwhelming at the onset.
It’s worth learning how to use them in order to get the most value out of the platform, especially given how powerful they can be.
The best way to learn more about the platform’s features is to schedule a free one-on-one training session.
There’s no better way to learn the tips and tricks of TrendSpider than seeing the platform in action.
If you have any questions for more TrendSpider tips and tricks, you can reach out to admin@colibritrader.com
Or, why not try out the platform yourselves- there is a 7-day Free Trial. Nothing to lose, after all…
