


7 Price Action Tips That Work

In line with the 10 Price Action Tips article that I have written recently, I wanted to give you some more relevant tips.
I will go even deeper and give you some more details on how to stay profitable with price action.
It has never been easier and more difficult to start trading
Easier: there is plenty of information out there and most of it is free
More difficult: The more information you are “bombarded” with, the more difficult it is to know what works and what doesn’t
Let’s start this article with a concept that is very popular, while still extremely misleading.
Contents in this article
- Trading Tip 1: Price Divergences and Price Action
- Trading Tip 2: Support and Resistance and Price Action
- Trading Tip 3: Supply and Demand Zones with Price Action
- Trading Tip 4: Fakeouts or Bullish/Bearish Traps
- Trading Tip 5: Fibonacci Levels and Price Action
- Trading Tip 6: Fundamental News and Price Action Tips
- Trading Tip 7: Best Timeframes for Price Action Trading
- Summary: Price Action Tips
Price Divergences- How Price Action Can Help You
I will not spend too much time explaining trading divergences.
You can check out my article on them, which will give you a detailed analysis of pros and cons of using them.
What matters for this article is how to combine divergences with price action.
Here are a few tips:
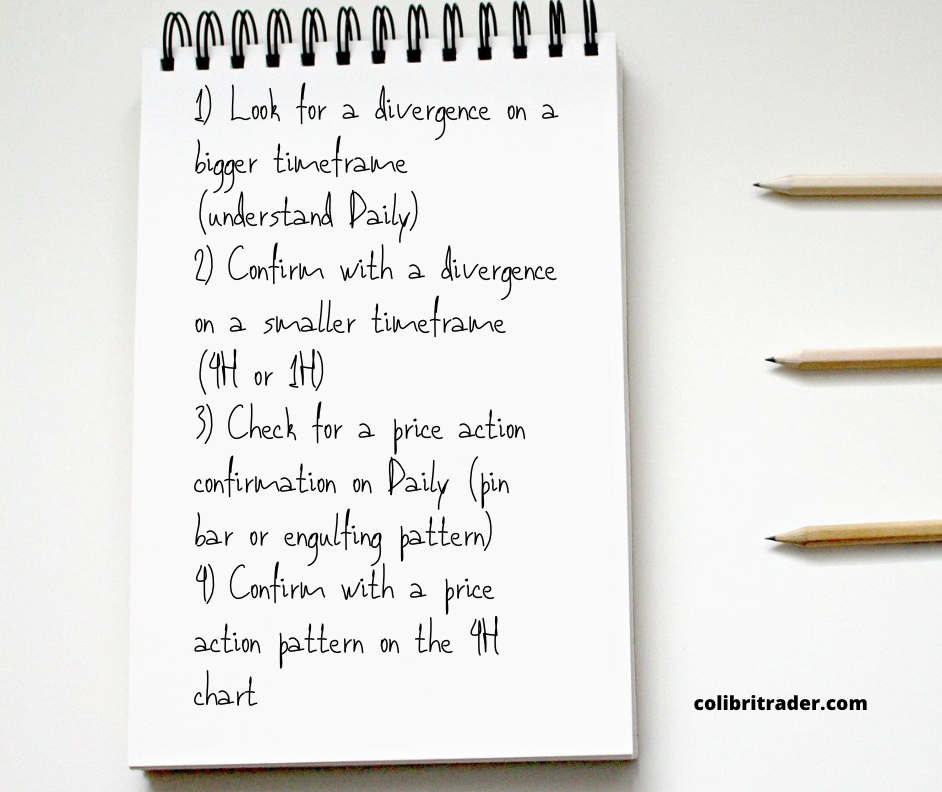
- Look for a divergence on a bigger timeframe (understand Daily)
- Confirm with a divergence on a smaller timeframe (4H or 1H)
- Check for a price action confirmation on Daily (pin bar or engulfing pattern)
- Confirm with a price action pattern on the 4H chart
The easiest way to find out if there is a divergence is to use the RSI indicator.
Use the standard feature of 14 days to start with and plug it into a chart.
That is how it would look like, for instance. Below is the daily DAX chart:

Let’s see what I am looking for when trading with divergences and price action.
First, let’s explore the daily chart:

Here is clearly shown a daily divergence.
Secondly, let’s have a look at the 4H chart:

This is a very good example of a perfect reversal.
Therefore, the conclusion is that divergences are underestimated by a lot, but if used in the right way, they could be extremely powerful.
Support and Resistance and Price Action
In this section, I would like to give you a few more price action tips.
First and foremost, Support and resistance are a major topic that you should familiarise yourself in details before we proceed.
Since this is a more advanced article, I would assume you know the topic very well.
In my trading, I am looking at a confluence of factors.
- First, when using support and resistance, it is essential that you have another tool to confirm a certain level.
Price action could be a great way of establish a re-test or a reversal.
Let’s have a look at the image below and see how price action could be useful.

Numbers are used to delineate every time price touches a support level
The letter above are showing every time the price bounces back from a resistance level.
Take number 1 as an example.
There is a bullish engulfing pattern and it signifies a bullish bias.
The letter B from the image above shows an inside bar, which is a reversal candlestick combined with the resistance level.
If we continue analysing, we can see that almost all of the candles around the support and resistance levels are prominent candlesticks.
What matters here most is that you should learn how to recognise price action confirmation around support and resistance levels.
This is one of the most powerful tools that I have ever used.
Maybe only supply and demand zones are as powerful.
Supply and Demand Zones
I have a few articles on supply and demand. Below you will find them:
If you are not familiar with those “magical levels”, you can read the articles above.
Here, I will assume that you are already familiar with them and proceed with my findings…
Price action and supply and demand zones go hand in hand.
These are zones very similar to support and resistance, which professional traders find on specific places on the chart.
Just like with support and resistance, I am looking for signs of a reversal or continuation based on where those zones are located.
Let’s take an example to make things clear.

As you can see from this example a supply zone or demand zone in combination with a price action pattern does a great job.
It is all about a confluence of strong factors that leads the price to new highs or lows.
The traders who know how to read price action find this process fascinating.
It is like a puzzle which can be solved with the help of those two simple tools:
- Supply/Demand Zones
- Price Action

Fakeouts or Bullish/Bearish Traps
I have given a lot of attention to a specific price action pattern- the bullish/bearish trap.
Take a closer look into this pattern, since it takes a major part of my trading.
Also called a “fakeout” this is one of the most powerful tools in the world of trading… at least for me 🙂
I am not going to spend too much time explaining it here.
One of the best price action tips that I can give you is to just be looking out for this pattern.
Even if you don’t personally believe in it, try to familiarise yourselves with it so that you can understand how other market participants are seeing it.
In a nutshell, the bull or bear trap is just a false breakout.
For the ones that have taken my supply and demand or day trading course, will know why those patterns are so powerful and why they work.
Here is an illustration that shows the principles behind this pattern.
Fibonacci with Price Action
It is important to know how to read charts.
Hence, price action is crucial when it comes to Fibonacci levels.
I have a couple of articles on Fibonacci.
If you are interested, you can check them out below:
As with the above mentioned support and resistance and supply and demand, price action plays a crucial role here, too.

After the price went down from the top to form a new low, it retraced to the 50% level.
Then it formed a bearish engulfing candlestick pattern from where the next step is to move lower.
The chart above is the most recent daily chart of DAX (Germany 30). Therefore you can check in time if that “prediction” will come true or not.
Let’s take another example, where price action has already happened and acted together with Fibonacci levels as a repellant.
From the EURUSD daily chart above you can see a similar pattern.
The price formed a new low.
From then it started rising.
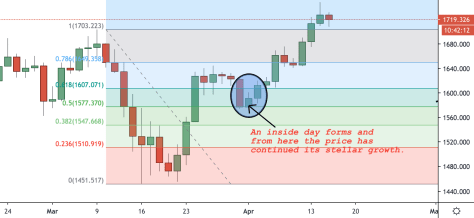
After it gained some momentum, it slowed down and re-tested the 50% retracement level.
This coincided with a price action candlestick- the inside bar.
Since then, EURUSD hasn’t stopped going higher and higher.
As you can see, Fibonacci levels such as areas of support/resistance have very strong connotations for the future development of a market move.
Let’s turn our attention to another way to see price action- fundamental news.
From this follows our next topic.
Fundamental News and Price Action
I would strongly recommend that you start by reading my article on fundamental trading.
If not, I just wanted to share with you here that I am not a very strong proponent of trading around major news.
As major news I understand:
- GDP numbers
- Non-Farm Payrolls
- Retail Sales
- CPI reports
- FOMC
Those are just 5 of the major releases, therefore I would not trade or recommend trading before.
There are major reasons for that and you can find them in the above-mentioned article.
What is important to note here is that many times after a major announcement price goes in one direction to only hit a major level and reverse.
In such circumstances the highly skilled trader might make money.

The best piece of advice would be to avoid trading around major news altogether if you are just starting out- .
Best Timeframes for Price Action Trading
As the general rule of a thumb goes, the higher the timeframe, the more sure the signal.
There is less noise on the higher timeframes and this makes them easier to trade, especially for a newcomer.
Unless you are really experienced, I would not recommend trading on the lower timeframes.
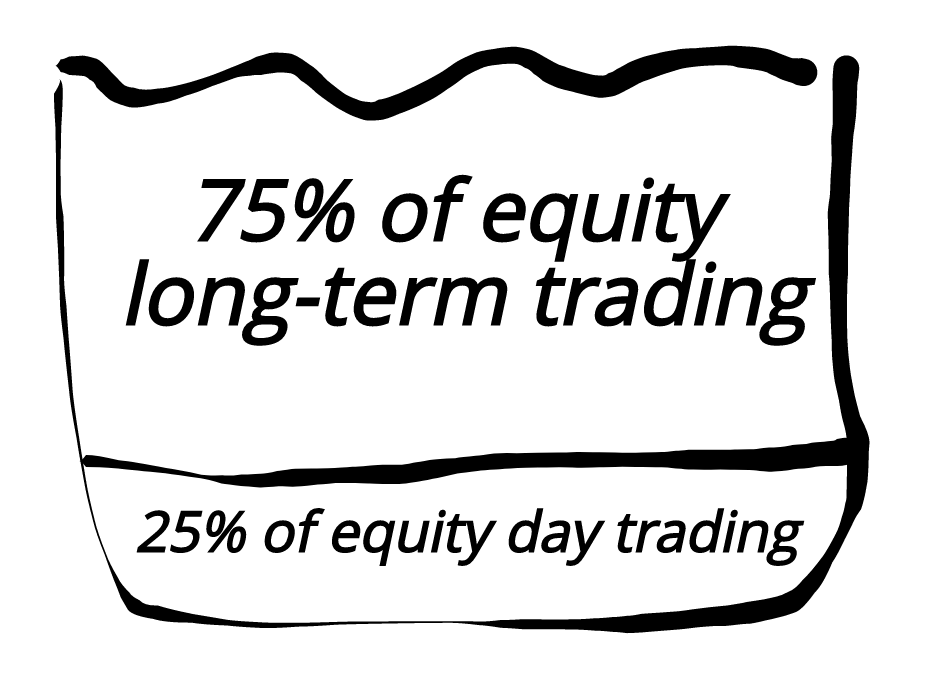
In my day trading strategy I only employ around 25% of my trading capital.
The rest of the money I trade with goes to my longer-term strategies.
No matter what strategy you employ, you must feel confident about it and know what you are doing.
Risk management is probably as important if not more that the trading strategy itself.
I cannot emphasise enough the importance of the right methodology in your trading.
Price action is important, but so are your risk management tools.
Daily vs. 4H timeframe and price action
One of my trading strategies includes those two timeframes and for a good reason.
Practice has taught me that any good trading strategy must use at least two timeframes for a good analysis and confirmation.
Price action acts as a trigger, but before you “pull” it, you need a target.
Other popular timeframes combinations are:

Summary- Price Action Tips
Trading with price action has always been my way of trading.
In the trading years behind me, I have tested all sorts of indicators and trading strategies to only put all my efforts in price action in the end.
I hope this article on advanced price action was helpful to you.
If not or if you still have any questions, please let me know by sending me an e-mail to: admin@colibritrader.com
Price action is not a means to an end by itself.
This is a way of seeing the market and reading the behaviour of the other market participants.
Price action trading is one of the finest ways of reading the tape!
p.s.
Check out my other article on price action trading or bull/bear traps to improve your knowledge on that matter.
Great stuff, thanks a lot, can you please explain (price action, supply&demand and order blocks) combination in your next article.
Especially the H1 order, please!
Please refer to my previous answer. If you still have any questions, please email me
Hi there, I already have an article on these. Can you please use the search bar and look supply and demand up. I have covered it in 3 major articles on this website
Thanks!