


5 Pin Bar Trading Strategies that Every Trader Must Know
5 Pin Bar Trading Strategies that Every Trader Must Know
by: @colibritrader
Bonus Material: Get the Free E-book on Candlesticks
Introduction
As the most liquid market in the world, Forex or foreign exchange attracts more and more retail traders. Everyone comes to the market with different expectations but aims for the same thing: to make money. Pin bar trading is a simple, yet effective trading strategy that offers excellent risk-reward ratios.
Technical analysis today differs significantly from the old days. The early 1900’s saw most of the trading theories trying to understand crowds’ behaviour.
Elliott, Gartley, Gann, Dow, they all looked at complex market behaviour and put everything together in a trading theory. However, regardless of the approach, technical analysis outcome is to forecast future prices.
 In the end, it is the trade that matters. For trading to make sense, money management defines the potential of a trade, with a risk-reward ratio of minimum 1:2 mandatory. Effectively, it means that for every pip risked, the reward should be at least twice the risk.
Elliott, for example, uses a complex logical approach to the market, interpreting various market cycles of different degrees. After a time-consuming process, labeling impulsive and corrective waves, the result is a trade respecting at least 1:2 as the risk-reward ratio.
Gartley uses Fibonacci ratios to find a trade at the bottom of a bullish or bearish trend. He developed a set of rules that results in a similar 1:2 risk-reward ratio for a trade.
All trading theories and concepts mentioned so far have a significant disadvantage. They are time-consuming.
It takes a lot of time for the market to form a pattern with the Elliott or Gartley theories. The same is valid for all classic technical analysis patterns: head and shoulders, wedges, flags, pennants, ascending and descending triangles, etc.
How about a simpler, yet effective approach to trading?
The Beauty of a Single-Candlestick Pattern
Since the Japanese introduced the candlesticks chart to the Western world, technical analysis changed completely. Japanese candlesticks made it easier for market participants to understand the price action within a period.
Before that, bars charts were the preferred choice. However, while showing the opening and closing prices, they lack the follow-through we see when interpreting Japanese candlesticks.
Japanese candlesticks techniques differ strikingly from the classic pattern recognition approach knew at that time. Japanese patterns are known for taking less time and being at least as 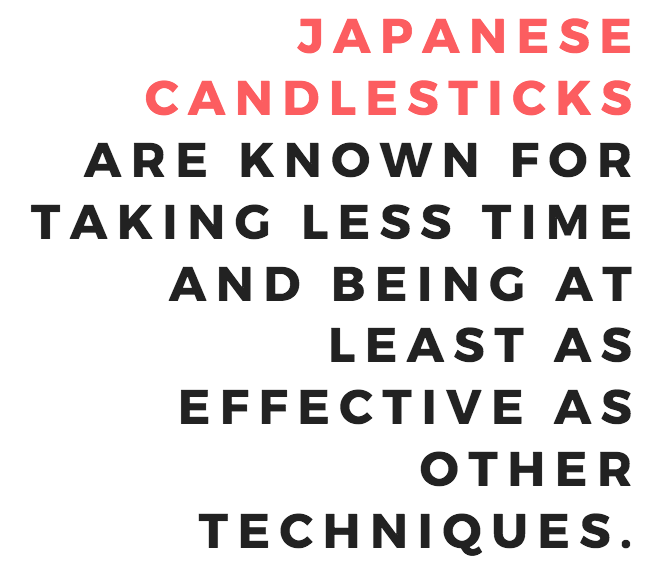 effective.
Many of the patterns took the Western world entirely by surprise. Morning and evening stars, bullish and bearish engulfing, not to mention the Doji candles, are only a few examples.
Yet, the Western approach already knew one pattern. A single-bar pattern, the pin bar was used since the early technical analysis beginnings.
Nowadays a candlesticks chart is the preferred way among Forex traders to look at a market. Hence, the pin bar became a single candle, but the principle to trade it are the same.
The equivalent of a pin bar in the Japanese approach is the hammer pattern. A hammer is a bullish pattern that forms at the bottom of a bearish trend. Hence, a reversal pattern, or a bullish pin bar.
However, a bearish pin bar at the end of a bullish trend has a different name in the Japanese approach: a shooting star.
Therefore, the equivalent of a bullish and bearish pin bar in the Western approach is the hammer and the shooting star in the Japanese technical analysis. But what makes a pin bar?
What Makes a Pin Bar?
Before more details, we need to explain what a candlestick is. To interpret a candlestick, traders consider the following:
- opening price
- closing price
- the highest value
- the lowest value
The difference between the opening and closing prices is the body of the candle. Also known as the real body, it is bullish when the closing price is higher than the opening one, and bearish when is lower. The price action to the highest or lowest point is the shadow or the tail.
For a pin bar to form, traders look at the real body to be relatively small, and the tail of the candle much longer. In fact, the longer the tail, the better.
While not a general rule, savvy traders look for the following condition to happen before pin bar trading: the tail to be so long, so the real body fits at least two times.
Conventional wisdom claims that a bullish pin bar must have a green body (closing price bigger than the opening one) and a bearish pin bar a red body (closing price lower than the opening price).
However, that’s irrelevant, especially considering today’s Forex market, when Forex brokers give accurate quotations.
The Pin Bar Trading Setup Explained
For a single candle, the pin bar is an impressive reversal pattern. It shows a terrible battle between bulls and bears, signalling that the previous trend weakens.
Hence, for a bullish pin bar, a bearish trend must exist. And, a bullish trend is mandatory before a bearish pin bar forms.
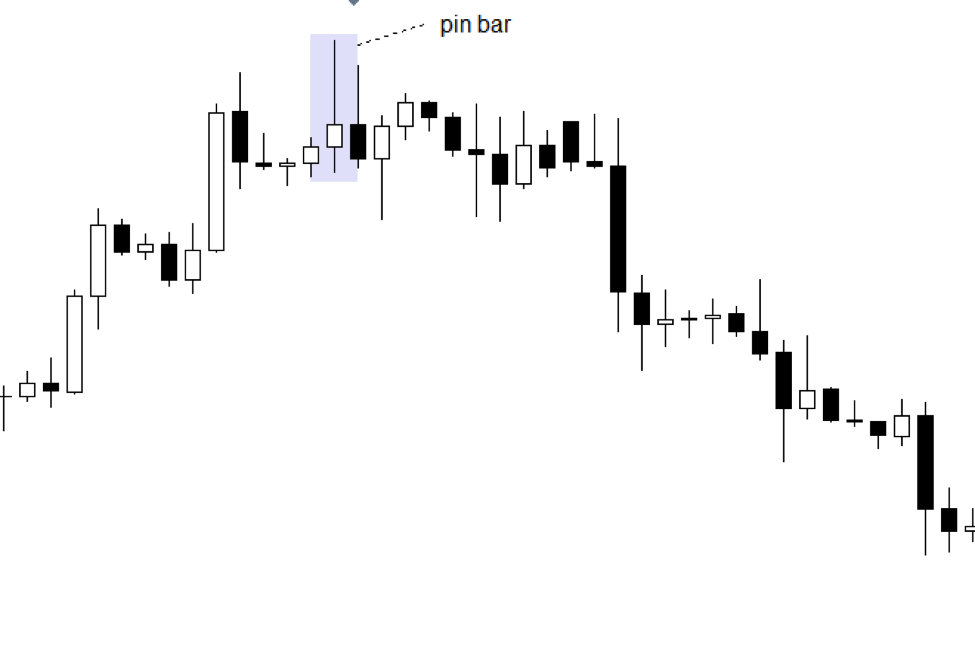
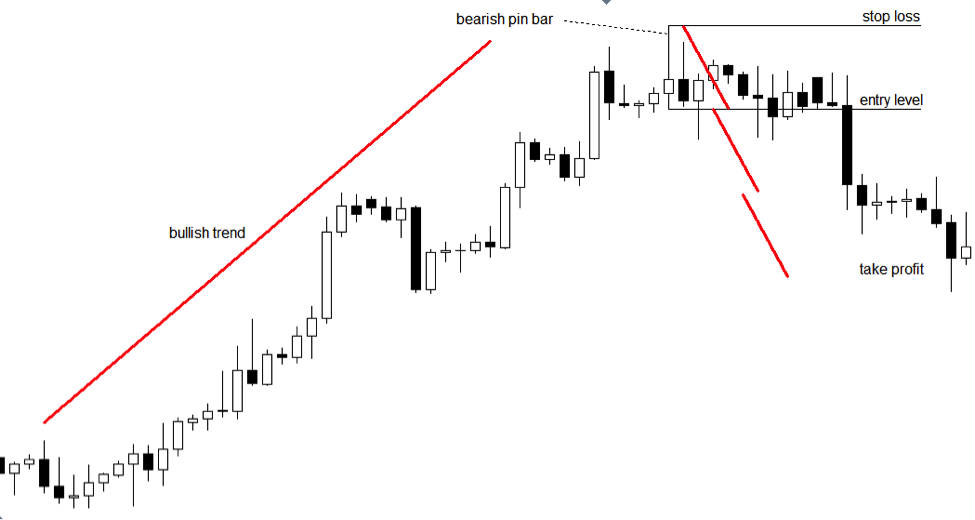
A pin bar trading strategy when it reverses a bullish trend considers the following steps:
- measure the entire length of the pin bar, from the lowest to its highest point
- go short when the price breaks the lowest point
- place a stop loss order at the highest point in the bearish pin bar
- project the length of the pin bar minimum two times below the entry point
Sometimes the market reverses so aggressively after a pin bar that the pin bar trading strategy offers a greater risk-reward ratio than 1:2. To make sure they’re not missing the new trend; aggressive traders move the stop at break-even when the price reaches 1:1 rr ratio and trail parts of it as long as possible.
Fibonacci Ratios with the Pin Bar Trading Setup
Savvy traders have patience, and they know that any reversal pattern shows a conflict. The conflict or the battle between bulls and bears implies the market won’t reverse quickly.
After a bullish trend like the one above, bulls won’t give up that easy. That’s the reason why every pin bar trading strategy needs a stop loss.
However, a pullback is more than welcomed. In fact, pullbacks often happen after a bullish or bearish pin bar.
Fibonacci ratios help in finding an even better risk-reward ratio. Here are the steps to follow on the same bearish pin bar setup:
- measure the length of the pin bar, from its highest to the lowest point
- use the Fibonacci Retracement tool for finding the 50% and 61.8% levels
- wait for the market to reverse to the defined area
- go short with a stop loss at the highs
- keep the same take profit as in the original setup
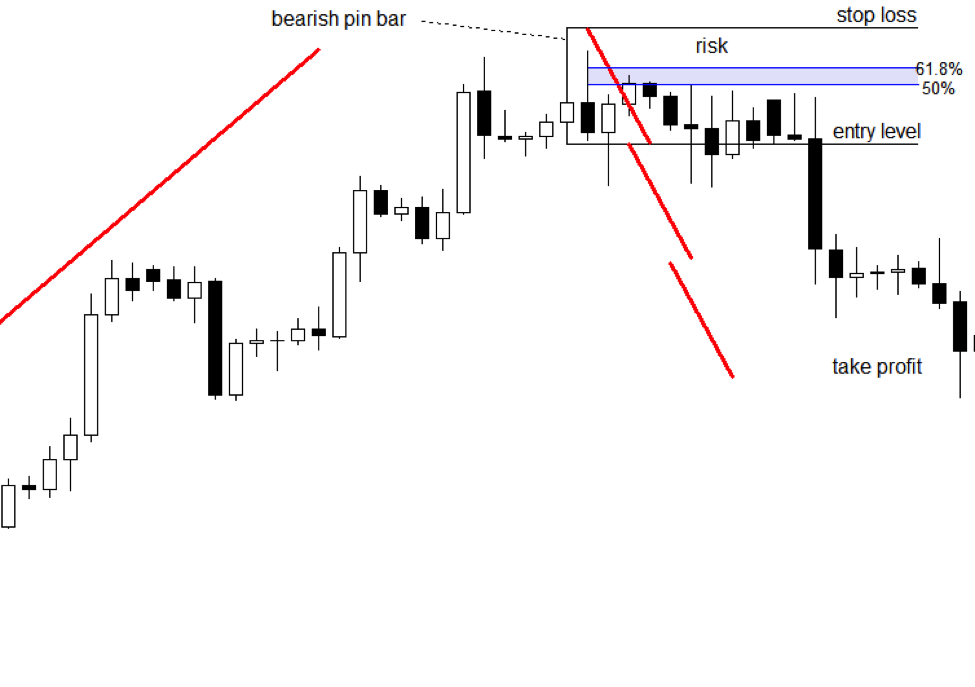
This way, traders stay for the same take profit, but with a lower risk. Hence, Fibonacci comes to complement the unique pin bar trading strategy by offering an even greater risk-reward ratio. Not bad for a single-candlestick pattern, right?
Pin Bar Trading in Confluence Areas
When two or more technical indicators point to a reversal from the same area, the market is said to form a confluence zone. Such places are difficult to break, and the rule of thumb goes that the higher the time frame, the stronger the area.
A confluence area could be a support or resistance level, coupled with another technical pattern. For example, if the market forms a double bottom on an area that previously acted as a support level, that’s a confluence area.
The same we can say about pin bars. When a pin bar forms as part of a different pattern, the market signals a strong reversal potential.
Pin Bars as Part of Classic Technical Analysis Patterns
As mentioned at the start of this article, classic technical analysis patterns have the disadvantage of consuming a lot of time. That’s a problem especially if the patterns form on bigger time frames.
Anyways, a trading setup using a pattern recognition approach still needs a stop loss and a take profit that suits the money management system. Because trading these days is mostly automated, the price action is driven by sophisticated trading algorithms in search for some stops.
They detect classic patterns quickly, and then the algos position against the crowd. For this reason, when trading currencies, patterns like wedges, head and shoulders, triangles, flags, double and triple bottoms, cup and handle, do fail sometimes.
They all consume tremendous amounts of time. When the market forms a triangle, it just trades in a narrow range until the b-d trend line breaks.
Or, in the case of a head and shoulders pattern, the left and right shoulders’ consolidations put patience to a test.
However, when a pin bar is part of a classic technical pattern, the chances grow that it’ll reach the take profit. Hence, traders use this signal to trade more aggressively when the pin bar reinforces a pattern.
Pin Bars and Wedges – A Powerful Trading Strategy
Wedges are of two types: falling and rising. A falling wedge is bullish and a rising wedge signals weakness.
During a wedge formation, the price action is confusing, to say the least. The market continues making higher highs and higher lows (in a rising wedge) or lower lows and lower highs (in a falling wedge) but without meaningful conviction.
The trendlines of a wedge give its shape. They converge towards a common point, until the wedge breaks.
Most of the times, before the price breaks the wedge, it pierces the opposite trendline. If/when it does that, traders look for a pin bar.
It comes as a confirmation that the market will, indeed, reverse. Because it is a confluence area, the pin bar trading strategy explained earlier won’t work most of the times. The rejection is abrupt and powerful so the pullback into the Fibonacci area won’t come.
However, trading the pin bar in a classic way works. On top of it, trading the wedge gives another trade too.
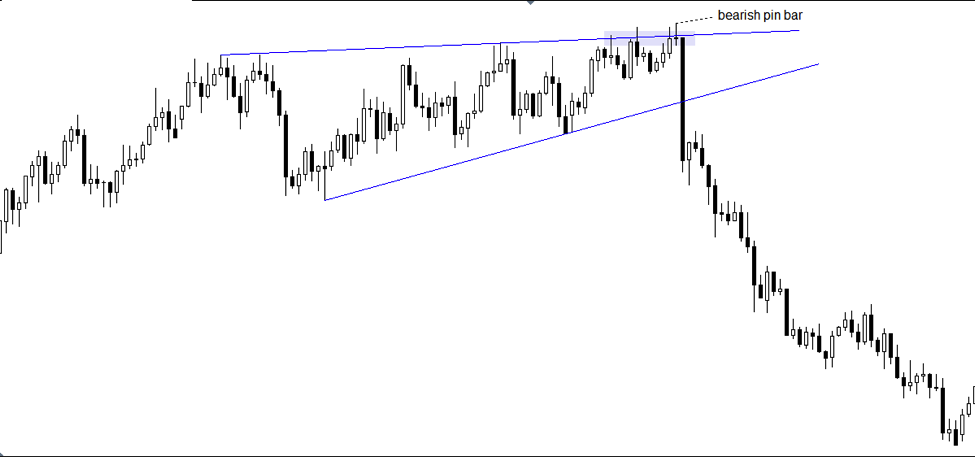
Here’s a chart explaining the confluence of two bearish patterns. The market rises in a bullish trend, forming a series of higher highs and higher lows.
However, the follow-through is only marginal. When the price pierces the opposite trend line, it does that forming a bearish pin bar.
In fact, it forms two bearish pin bars. The first piercing of the trend line is a bearish pin bar too, invalidated by the future price action.
Yet, the market fails to advance and forms another pin bar. This time, the rejection is so firm that the next candle breaks the wedge.
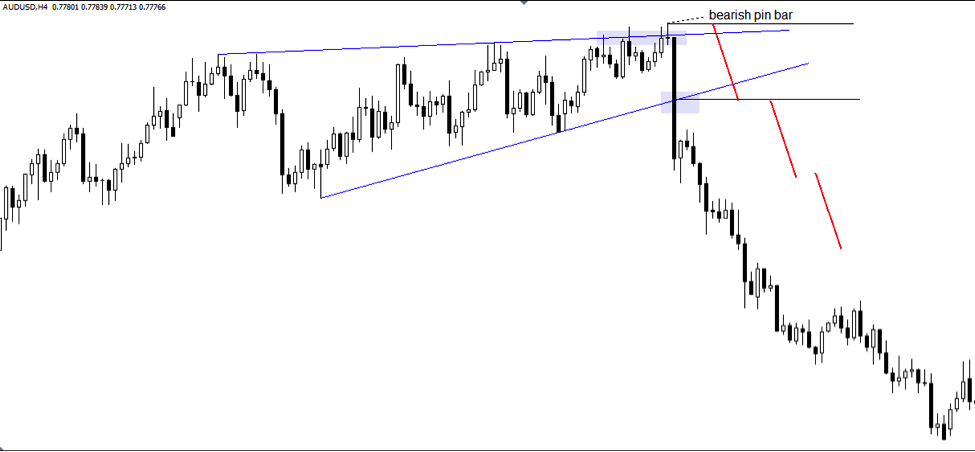
From this moment, traders focus on trading the rising wedge. As such, they:
- go short when the wedge breaks
- place a stop loss at the top of the wedge (highest point in the bearish pin bar)
- measure the risk and project a minimum 1:3 risk-reward ratio
Pin Bar Trading Against Dynamic Support and Resistance Levels
Typically, support and resistance forms on the horizontal. This is the easiest way to spot excellent support or resistance areas.
However, dynamic support or resistance levels are more difficult to break. They rise and fall with the price action, offering exceptional places to add when trend trading.
To find dynamic support or resistance levels, we need to draw a trendline that follows price closely. The line of a trend starts from two points, and then traders project it further on the right side of the chart.
In a bullish trend, the key is to identify the series of higher lows and connect the bottom with the first higher low. Those are the two points needed.
Next, drag the trendline on the right side of the chart. Every time the price comes to the trendline, it meets dynamic support.
Be careful though on the number of times the price tests a trendline. The more times it touches it, the weaker the trend becomes.
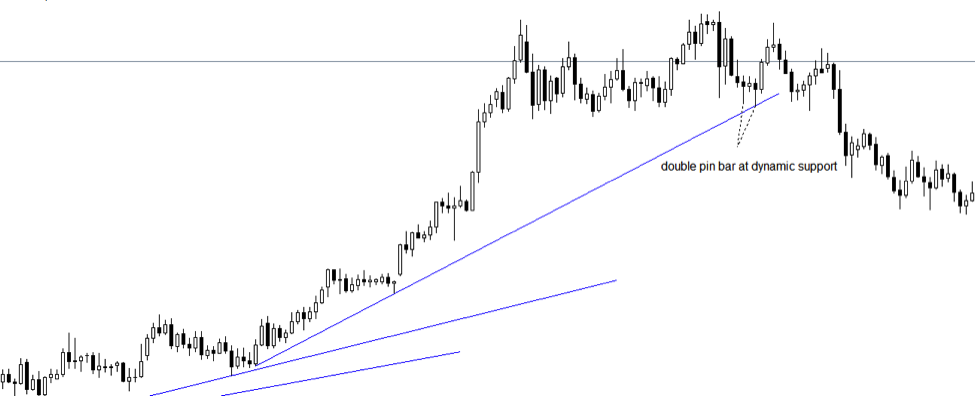
Because a pin bar is a single candle, when and if it forms against a trendline, it signals a continuation pattern, not a reversal. It comes to reinforce the bullish trend, and the market will shoot higher.
That works especially if the price tests the trendline for the first time after the two points were connected. Because multiple retests show a weakening trend, traders avoid the third or the fourth time a dynamic support or resistance appears. Or, they reduce the volume traded.
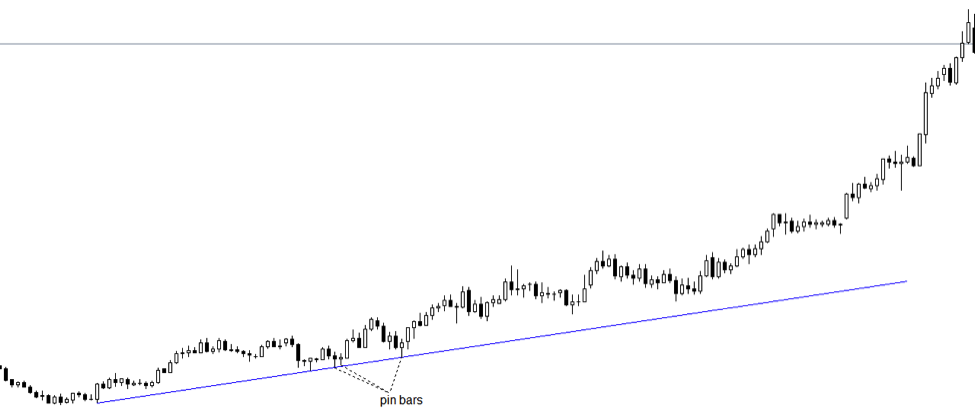
The chart from above is the USDCAD daily timeframe. Hence, each candle represents one trading day.
The line of the trend is tested for the first time not with one, but with two consecutive pin bars. This is a powerful bullish confluence pattern, as the price meets:
- dynamic support given by the rising trend line (for the first time)
- double bullish pin bars
How to Trade a Pin Bar as a Continuation Pattern
Naturally, the price breaks higher. Trading the pin bars as continuation patterns follows the same steps as before:
- measure the distance between the highest and the lowest point in the pin bar
- go long at the top of it
- place the stop loss at the lowest point in the pin bar
- target minimum 1:2 risk-reward ratio
In strong trends, the market deviates sharply from the main trend line. As such, traders repeat the process, even though the angle becomes more aggressive.
Following the same steps, another trading setup appears. This time, long after dragging the new trendline, the price tests the dynamic support for the first time.
In doing that, it forms two bullish pin bars. The three days to follow show only bullish price action, with the 1:2 risk-reward ratio reached.
Conclusion
The pin bar trading strategies presented here aimed to show a simple approach to technical analysis. Nowadays traders use sophisticated trading strategies to come up with less productive trades.
The main advantage of using a pin bar trading strategy is its simplicity. Plus, being only a candle, there’s not much time to wait with an open trade, nor margin blocked in the trading account.
When money management rules accompany a trade, the confidence grows. Even if the stop-loss gets hit from time to time, it’s only reasonable.

Because the trades resulted from the pin bar trading give tremendous risk-reward ratios, a stop-loss being hit doesn’t affect the trading account. Plus, money management requires an appropriate balance between the size of a trade and the timeframe.
The beauty of using pin bars is that they form often. And, they appear on all timeframes.
Starting with the lowest ones, and ending with the monthly chart, pin bars tell much about the price action in a candle.
Few traders know that pin bars act as continuation patterns too. When forming against dynamic support or resistance levels, pin bars become powerful trading setups.
To sum up, for a single candle, a pin bar is a sharp reversal and continuation pattern. Make sure you always have the right stop-loss in place and target much more than the risk involved, and you’ll stand high chances to make it in the currency market.
If you want to fully understand the way I trade the markets, check out my professional trading system
Here is an excerpt from the course:
Nice & very effective resarch i am looking for as i am very beginner in this field
Please let me know if you have any questions!
very Nice Web i discover, i m from West Africa and i Will recommend it to Many of africans. But WhatsApp i wanted is à complète course of candelsticks :
High bullish reversal
high bear reversal
High continuation candelsticks