


Trading With Chart Patterns-15 Chart Patterns in Forex Trading That Every Serious Trader Should Know
Trading With Chart Patterns-15 Chart Patterns in Forex Trading That Every Serious Trader Should Know
Trading with chart patterns in Forex is something familiar for every retail trader these days.Technical analysis has existed for centuries. Yet, only recently it became wildly accepted among traders and institutions alike.
The art of interpreting patterns, technical analysis exists on the belief of some traders that the markets aren’t efficient.
>>Trading With Chart Patterns PDF
Click Here to Download<<
Market efficiency is subject to strong debates for years, with technical analysts arguing that a profit can be made as markets are irrational.
This irrationality comes from the erratic behaviour of the masses. This is the main substance of technical analysis.
Contents in this article
Irrationality and Chart Patterns
Because human nature plays tricks on us all, practitioners of technical analysis believe that this characteristic exists in markets too. After all, it doesn’t make sense to think that trading is the only exception where humans behave rationally.
Think of the last time you closed a trade before the price reached your target.
Why did you do that?
Probably greed or fear played a role. Your rational side of you knew that this is not why you got into that respective trade. However, the illogical, irrational part of human nature drives us to different paths in life. And in trading also.
Trading with chart patterns is an essential component of every technical analyst. Here, we don’t talk about trading theories.
Instead, we talk about “traces” the market leaves behind. Because a chart records every price level through time. This helps traders interpret the data through reading chart patterns.
Trading with Chart Patterns in Forex – What Every Trader Must Know
The beauty of technical analysis is that traders use it on any market. Also, any timeframe.
However, there’s an imperative condition in place. That is, technical analysis works on freely traded markets.
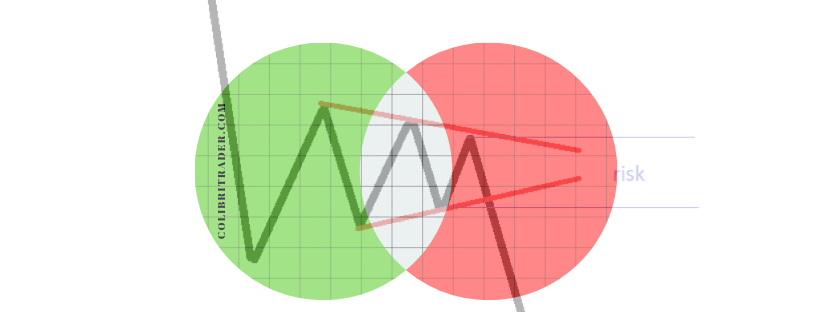
When regulators intervene, technical analysis might not work anymore. After all, central banks intervene from time to time to support a currency.
Yet, plenty of examples exist that even under such circumstances, the technical trader has an advantage. Namely, by sticking to the patterns and applying money management rules, nothing else happens but being stopped out.
Market interventions are believed to alter patterns on the bigger timeframes more rarely. For instance, in January 2015 the SNB – Swiss National Bank dropped the peg on the EURCHF 1.20 floor.
After years of holding the level, the SNB dropped it suddenly. Everyone knew the central bank was on the other side of the trade for years.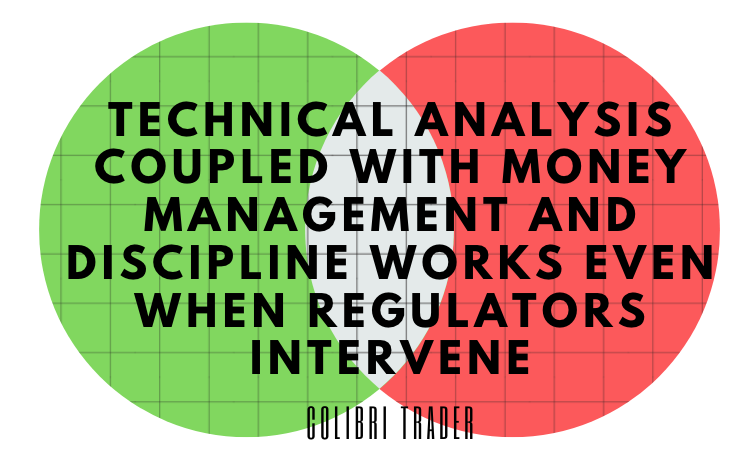
Yet, a quick look at that pattern reveals a descending triangle on the bigger timeframes. In other words, technical analysis coupled with money management and discipline works even when regulators intervene.
Technical analysis without charts is not possible. Therefore, chart patterns sit at the core of technical analysis, and they represent the basis of this article.
The aim here is to discuss the most relevant chart patterns in Forex. Some of them you have probably already read in my other article on chart patterns HERE.
However, instead of merely presenting them, I aim at disclosing unusual tips when trading with chart patterns. More precisely, things you probably don’t know about chart patterns in Forex trading.
Some of the chart patterns presented here you have already probably heard of. However, I’ll focus on some particularities that you might find useful.
Triangles – The Most Powerful Chart Patterns in Forex
Chart patterns belong to classic technical analysis. Mostly documented in the Western world, in the United States, they stood the test of time as reliable formations to predict future prices.
When trading with chart patterns, it is said that the trader has a pattern recognition approach. Such an approach means that the trader focuses more on price action and what the pattern shows, rather than particularities of a specific market.
All markets, regardless of type, have one thing in common. That is, they all consolidate ranges.
A lot.
Therefore, one of the most common chart patterns in Forex, and not only, are triangles. Triangular patterns come in many types and shapes.
Unfortunately, for the Forex retail trader, only the most common ones are known. Yet, the currency market is the source of vicious and curious patterns, so triangles evolved into different “species” and categories.
It is no wonder triangles take the biggest chunk of this article, as the types in this category are very common when trading with chart patterns.
Ascending and Descending Triangles
One of the chart patterns in Forex trading- “Ascending” and “Descending” triangles have one thing in common: they reveal powerful price action.
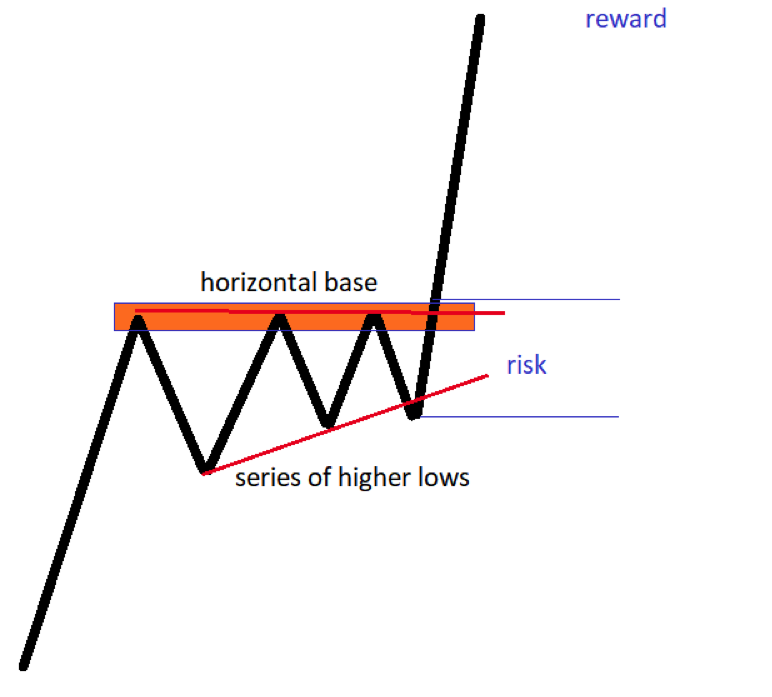
Effectively, the price builds energy to break higher (in the case of an ascending triangle) or lower (in the case of a descending triangle). But, there’s a catch: the price action revolves around a horizontal base.
The horizontal base is key in interpreting ascending and descending triangles. More precisely, if there’s not a horizontal base, the pattern falls into a different category.
The concept of an ascending and descending triangle changed in time. Chart patterns in Forex adapted to the particularities of this market.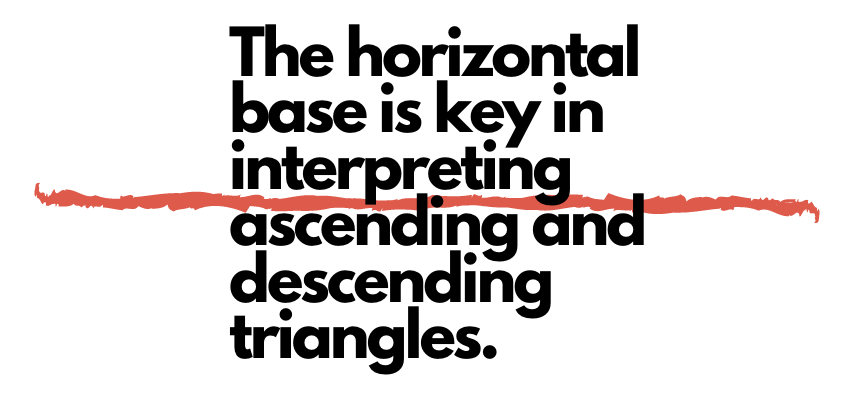
Back in the days when technical analysis was mainly practiced on the U.S. stock market, ascending and descending triangles had their base against a fix value. That’s not the case in Forex trading, as rarely, if ever, the price respects a level by the pip.
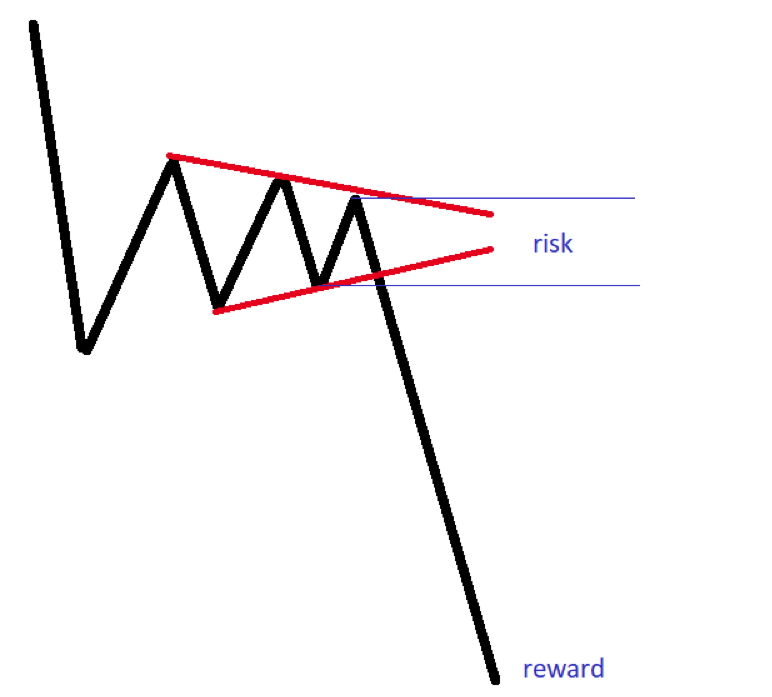
Here’s what makes an ascending triangle. First, make sure there’s a horizontal base in place. Second, the dips don’t break the series of higher lows.
Finally, on a breakthrough, the horizontal resistance area, go long with a stop-loss at the last higher low, targeting 1:3 rr ratio. That is, target is three-times the initial risk taken.
The classic measured move for such a triangle is the length of its longest segment. However, you can still end up losing money if you don’t use a rigorous risk-reward rules.
The measured move is there just to confirm the pattern. It doesn’t mean the price won’t advance anymore by the time it reached it.
 The opposite is of course valid for a descending triangle.
Symmetrical Triangles
When the base isn’t horizontal, the pattern morphs into a symmetrical triangle. Such triangles have a similar interpretation to ascending or descending ones.
In the end, the main trend resumes after the triangle’s break.
However, a couple of things are worth mentioning here, besides the standard interpretation everyone knows.
- Firstly, the price action almost always retests the triangle after the breakout. If it doesn’t, that’s a huge question mark regarding the validity of the pattern.
- Second, if you target only the measured move (the longest segment), you’ll miss most of the resulting price action. Just like in the case of ascending and descending triangles, that’s just the minimum target where the price should go. As such, to make the most of this chart pattern in Forex trading, use a 1:3 rr ratio.

Limiting Triangles
An unusual and rare case of triangular chart patterns in Forex trading, limiting triangle do what the name suggests: they limit the resulting price action.
The particularity of these triangles is that during the triangle’s formation, and all the way until the breakout, no parts of the price action pierces the two trendlines. If that happens, that’s not a limiting triangle.
When trading with chart patterns, the smallest details make the difference. In this case, while it seems unusual for price not to pierce the trendlines, that’s what makes such triangles powerful.
This feature matters because the resulting price action forms a pattern.
- First, the price breaks the triangle.
- Second, there is NO retesting.
- Third, the price continues in the primary trend’s direction and makes a new high.
- Finally, the price reverses to the apex of the limiting triangle.
For those not knowing, the apex is the common point where the two trendlines that make the triangle, meet. It acts as a support and resistance level for future price action.
Non-Limiting Triangles
A non-limiting triangle has no barriers against future price action. They typically appear as reversal patterns, even though sometimes they do continue the existing trend.
Two key features exist to distinguish limiting from non-limiting triangles. Firstly, non-limiting triangles ALWAYS retest the broken trendline.
Secondly, the apex of non-limiting triangles plays no role as to provide support and resistance for future price action.
Important: Non-limiting triangles are chart patterns that form more often.
A pattern recognition approach that uses trading with chart patterns uses most of the times non-limiting triangles.
One final thing about non-limiting triangles: they have no measured move whatsoever.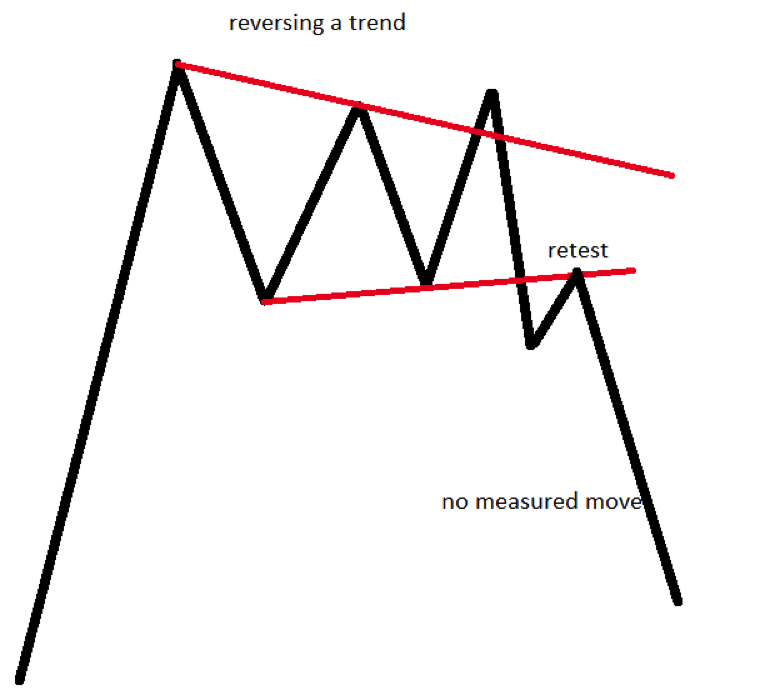
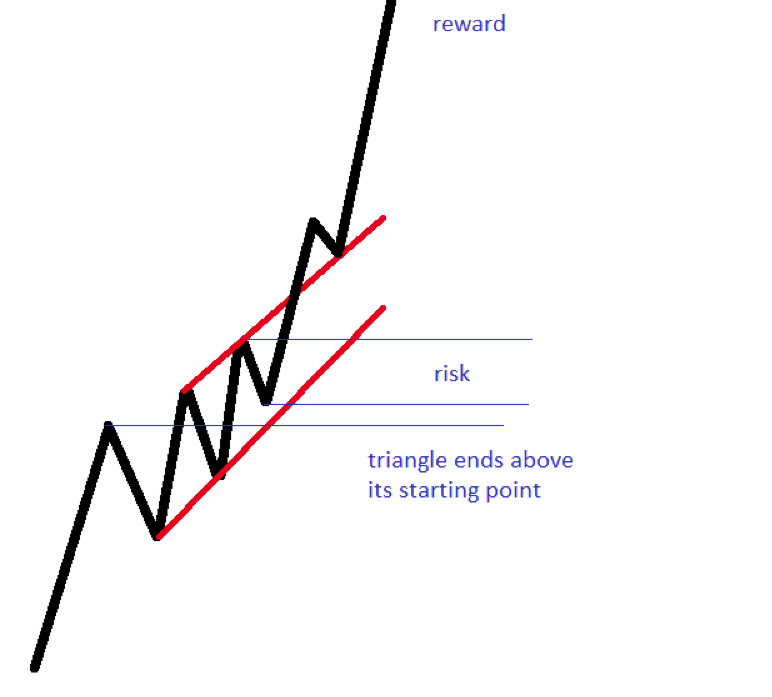
Running Triangles
The concept of a running triangle is controversial. However, it is one of the most common
and powerful chart patterns in Forex.
The idea behind a running triangle is that it ends above its starting point (in a bullish trend).
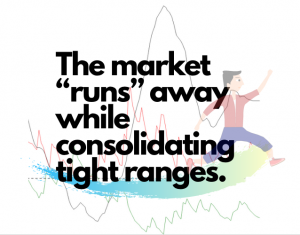
In other words, the market “runs” away while consolidating tight ranges.
Needless to say, the explosion higher dwarfs the price action following any other triangular pattern.
Therefore, traders use a risk-reward ratio of 1:5 or even more when trading with chart patterns like the running triangle.
Special Types of Triangles
The chart patterns that fall into this category resemble one we’ll discuss later in the article. I’m sure everyone has heard of the head and shoulders pattern.
A powerful reversal pattern, it forms at tops and bottoms, at the end of trends. However, have you ever thought of it as a triangle that reverses a trend?
Because, in fact, it is a triangle. Just a special type, known in the Elliott Waves world as a triangle with the c-e base.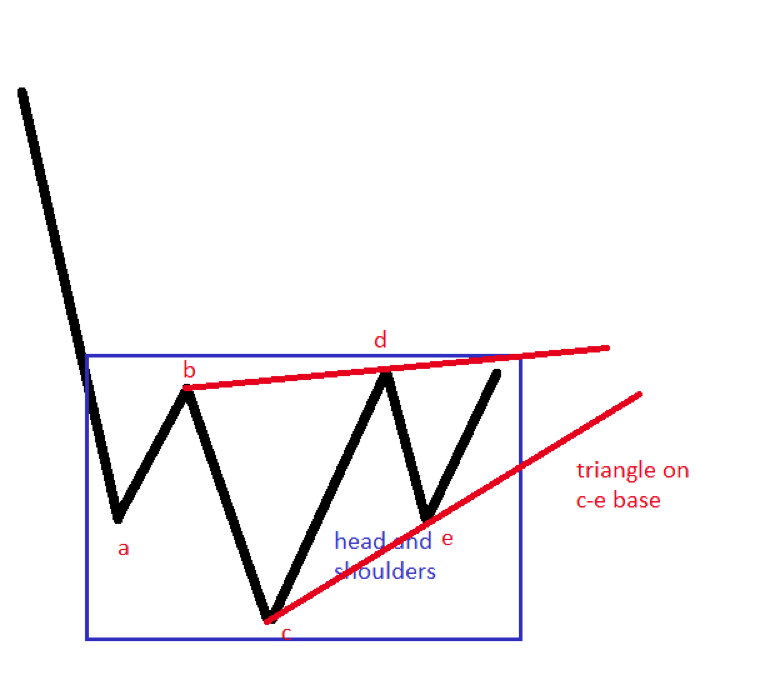
Wedges
Popular chart patterns in Forex, wedges appear everywhere. Two types of wedges exist:
- rising
- falling
Rising wedges have a bearish characteristic. The price is bound to fall by the time it breaks the lower trendline.
Similarly, falling wedges rise. Or, the price explodes higher after it breaks resistance on the upper trendline.
Rising and Falling
Some particularities of rising and falling wedges exist. Most traders know them as reversal patterns, which is the case most of the times.
When trading with chart patterns that fall into this category, consider the following. First, the final leg of the wedge pushes against the trendline. Without this, you may want to ignore the overall pattern.
Second, wait for a retest of the lower trendline (in the case of rising wedges) or the upper one (in the case of falling wedges). That’s a great entry place for a trade.
Finally, always have a stop-loss above the highest/lowest point in the wedge. And, a rr ratio of minimum 1:3.
Wedges as Continuation Patterns
One of the conditions mentioned earlier is to always have a stop-loss when trading a wedge. What can go wrong when trading such chart patterns in Forex?
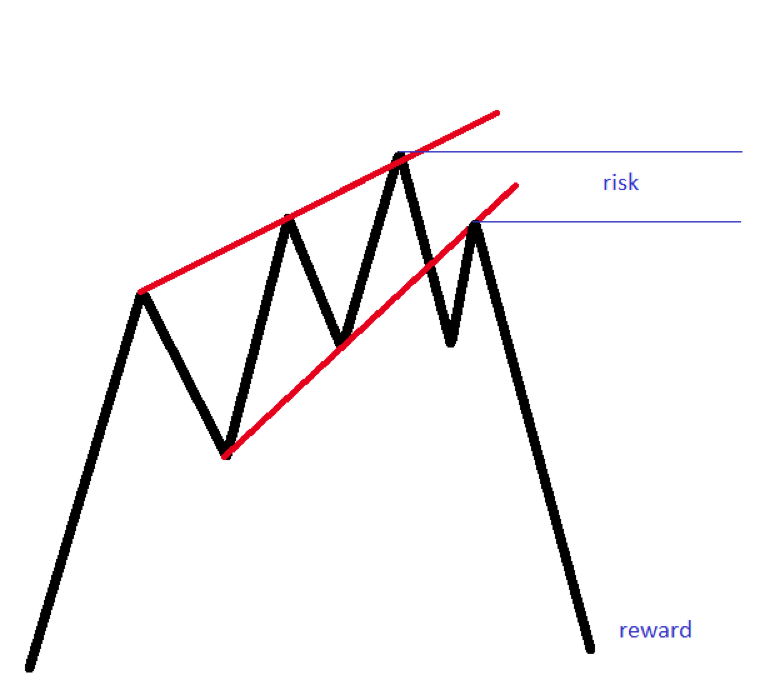
You already know the answer. A running triangle is a pattern that resembles a wedge, only that it breaks out in the opposite direction after reaching the extreme point of the wedge.
Here’s the running triangle pattern again:
Notice the wedge looking-like formation? After the price broke higher, it never looked back anymore. Hence, a SL is mandatory when trading wedges. They can be powerful continuation patterns.
Head and Shoulders
As mentioned previously, the head and shoulders pattern reverses trends. You may have heard of it already, but below you will find some interesting aspects regarding the head and shoulders pattern.
Particularities of the Head and Shoulders Pattern
While most traders focus on price, the time element plays an important role when trading with chart patterns like the head and shoulders. Look for the time it takes the left and right shoulders to consolidate to be similar. The more alike, the more powerful the pattern.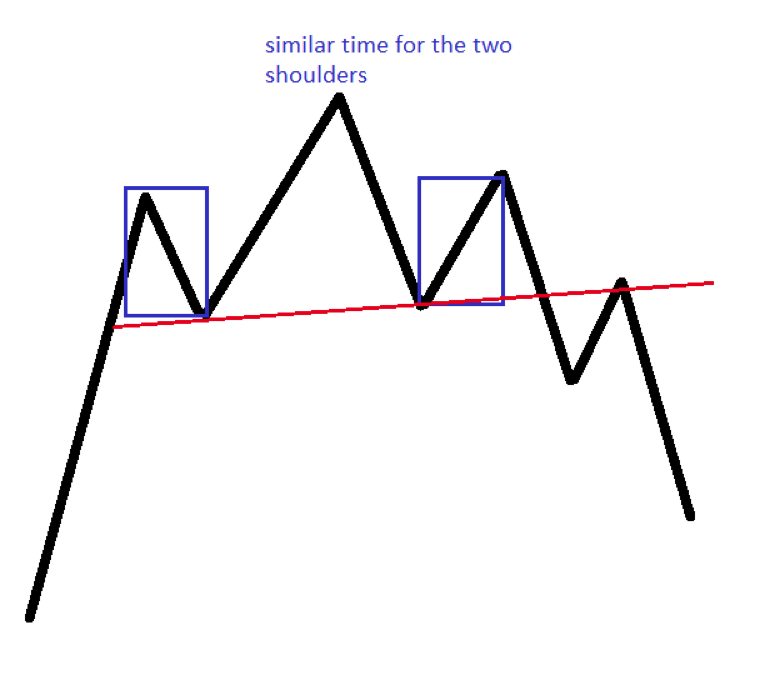
Head and Shoulders as a Continuation Pattern
Is this even possible?
The answer is positive.
Normally, head and shoulders are reversal patterns. However, sometimes they form in an unusual place.
Namely, when an inverted head and shoulders pattern appears at the top of a bullish trend, it is a bullish sign!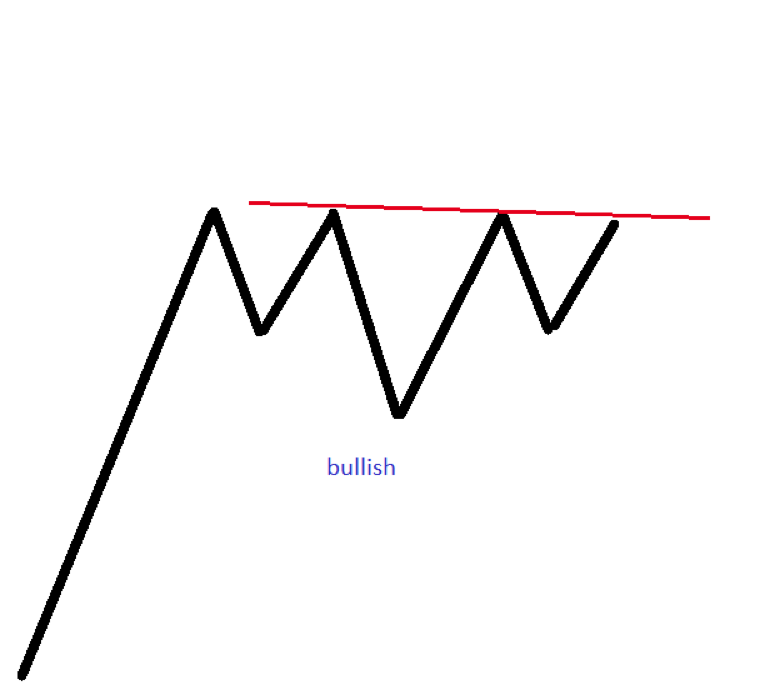
Triple Tops and Bottoms
We’ll mention only the triple top formation here, not the double ones. The reason for that is that triple tops or bottoms are more reliable than double tops/bottoms.
A triple top needs a horizontal base. Just like in the case of an ascending triangle, that’s mandatory. And, it is an area, not a level.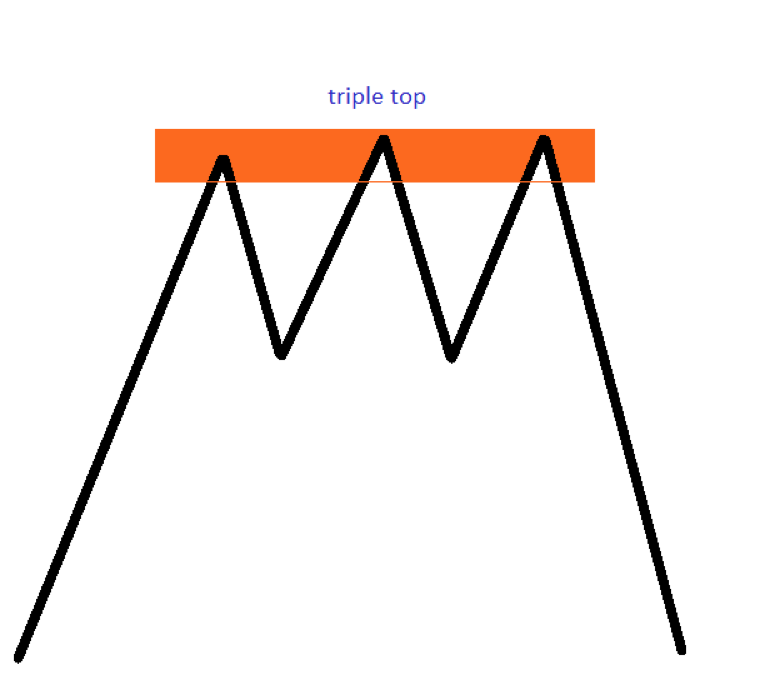
But these are one of the most reliable chart patterns in Forex. The problem with them is that they don’t appear that often.
Triple Tops and Bottoms Rarely Hold
They rarely hold, indeed. Most of the times, the price just builds energy and breaks out in the direction of the main trend.
Is this below a triple top?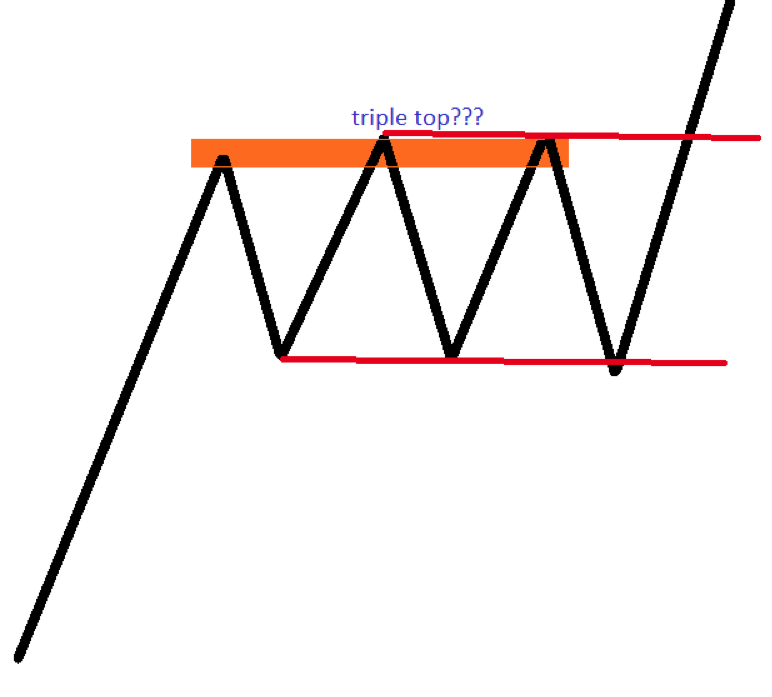
Think twice.
In the end, it is possible to see a triangle or a bullish flag.
How come?
Because TRIPLE TOPS AND BOTTOMS OFTEN TURN INTO CONTINUATION PATTERNS.
Diamond Formations
Diamonds show continuation. Their unique characteristic is a spike higher (in a bullish pattern), almost vertical.
However, the price drifts lower afterward, until reaching the diamond’s edge. And that’s when the real break comes in.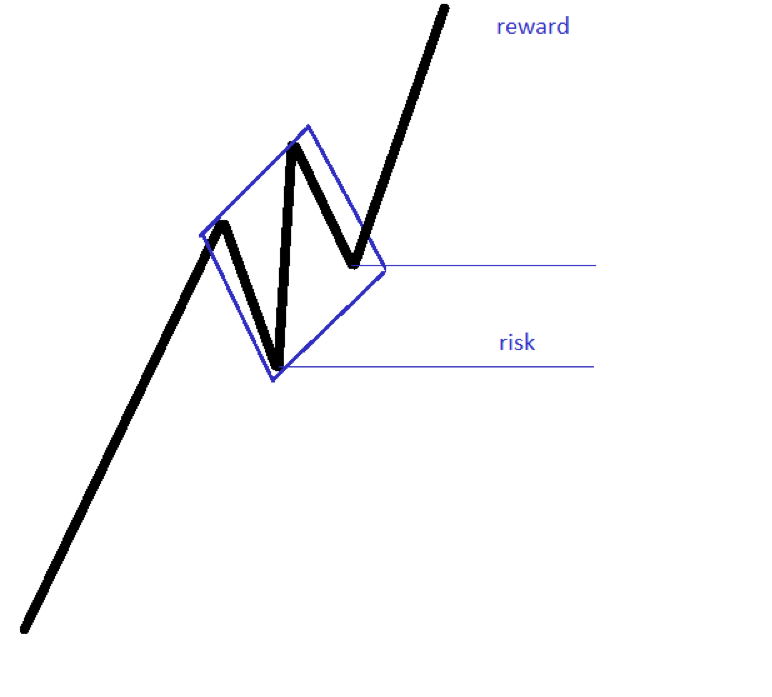
Patterns Within Patterns
We cannot finish this article about chart patterns in Forex without mentioning Japanese candlesticks patterns. While we won’t treat them in detail, there’s another reason to include them when trading with chart patterns.
Because they come to reinforce the classic chart patterns, Japanese candlesticks patterns act as patterns within patterns.
As a rule of thumb, classic chart patterns in Forex as the ones mentioned so far in this article, are more powerful if one of the three Japanese patterns from below appears in conjunction with it.
The Hammer
A one-candlestick pattern, the hammer (pin bar) appears at bottoms. When forming at the lowest point of an inverted head and shoulders pattern, it reinforces its reversing power.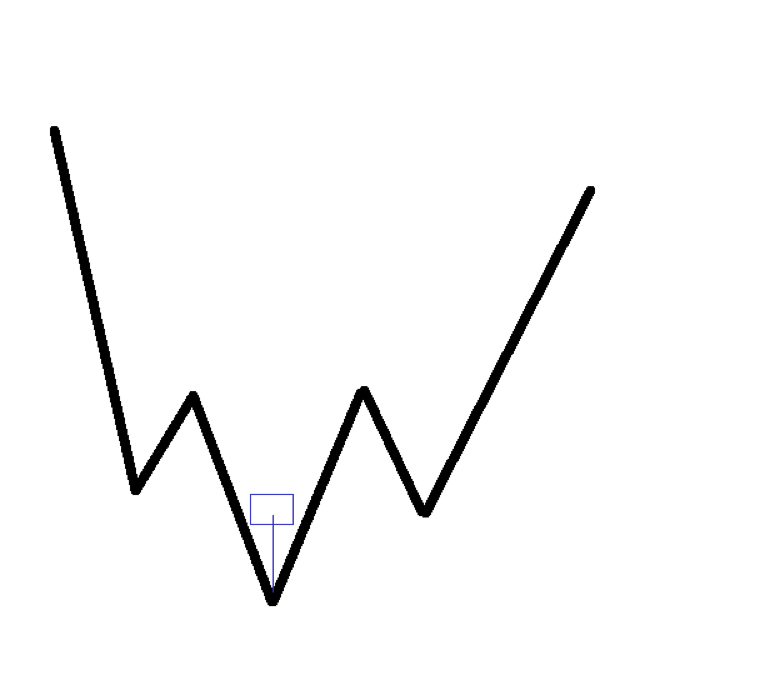
The Doji Candlestick
Still a single-candlestick pattern, the Doji candle has little or no real body. At tops or bottoms, it is a reversal pattern, as it signals that the end of the trend is imminent.
For instance, a Doji at the top of a rising wedge reinforces its bearish bias.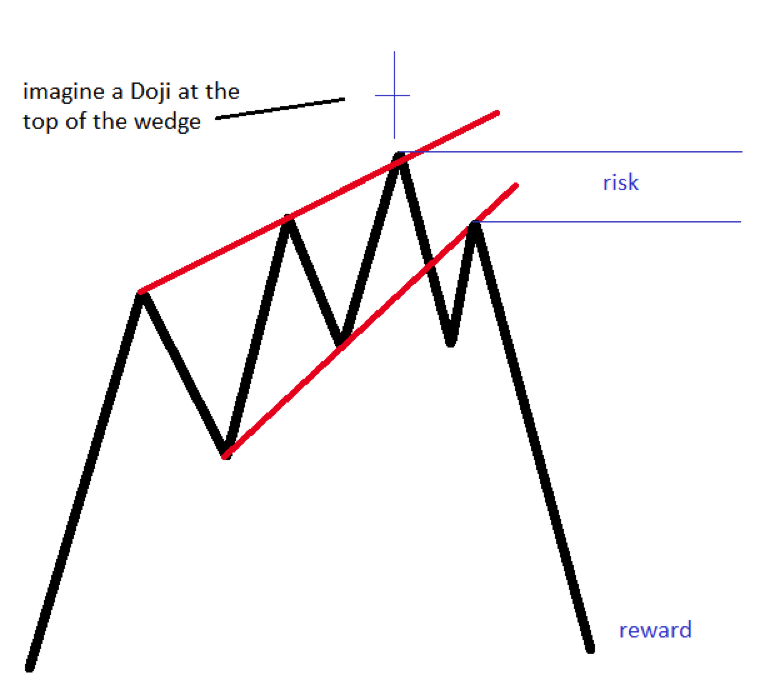
Morning and Evening Stars
A three-candlestick pattern, morning and evening stars are powerful chart patterns in Forex trading. When combined with classic technical analysis patterns, their power increases exponentially.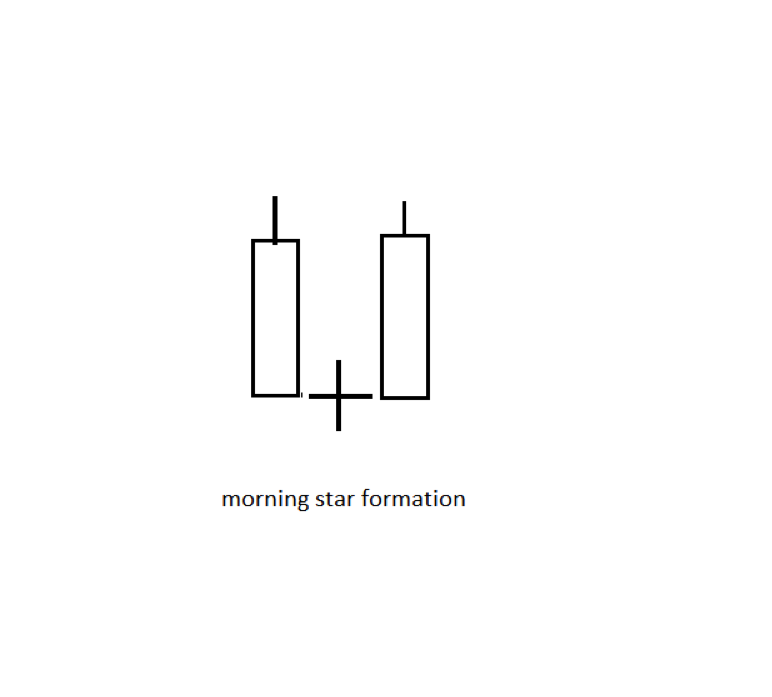
Conclusion
The chart patterns in Forex evolved in time. And they’ll continue changing more as markets evolve, too.
When trading with chart patterns like the ones presented in this article, remember that everyone knows their standard interpretation. This is why, with the further details provided here, you could potentially have an edge ahead of other market participants.
As shown, reversal patterns might act as continuation ones, too. Moreover, details regarding triangular patterns allow us to differentiate between them.
What matters is that the sum of these details ends up building trust in a trading system. Like any approach, pattern recognition works to the extent that we use it together with sound money management principles.
This is why, for most of the chart patterns in Forex, using proper risk-reward ratios is mandatory. Otherwise, the risk is that the pattern morphs into something else and invalidates the reason why we have entered in a particular trade in the first place.
Instead of a last word, here is a video I have created on chart patterns:
p.s.
Have you seen my article on 5 Different Strategies to Trade with Moving Averages?
Very good article Colibri but I would really appreciate a higher VOLUME LEVEL as the AUDIO PLAYBACK LEVEL was quite low on this video in my opinion as I had my volume turned up to MAXIMUM & the sound level was still very low. If you can please raise the VOLUME LEVEL on your future videos, most viewers like me would really appreciate it. Thanks Colibri for all the great work you do to help us traders.
Hi Ed, thank you for the good point. I will make sure to change this in my future videos. Anything else, please let me know!
Hello . I am Elizabeth from Botswana and would like to be thought how to use Patten to trade. Please mentor me on it.
Hi Elizabeth. Can you be more specific? I do trade mostly with price action. If you are interested, you can check out my trading course pages. Let me know if you have anything more concrete on mind
Good information… Thank you alot
Thanks. Let me know if you have any questions
This is very helpful you are such a blessing. I purchased one of your book ” The Ultimate Price Action Trading Guide” and you mentioned this website in your book so w/o hesitation I visit this website and got so many useful ideas. Thank you so much .
Thank you for the nice words! Feel free to ask me anything regarding price action trading or chart patterns
HEY BRO PLEASE THE ACENDING AND DECENDING PATTERN YOU MENTIONED ABOVE IS IT AN EXACT LEVEL OR A ZONE. THANKS IN ADVANCE FOR REPLYING
PLEASE DO YOU HAVE ANY TOPIC ON BEARISH FLAG AND BULLISH FLAG THANKS